Bioinformatic software miRNA analysis
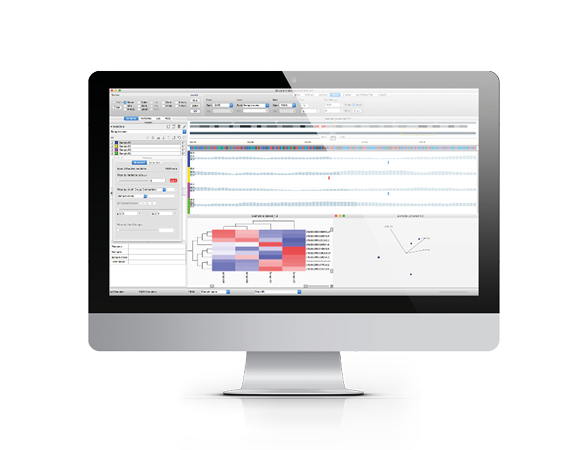
Qlucore Omics Explorer is a next-generation bioinformatics software for research in life science, biotech, food and plant industries, as well as academia. The fast and interactive visualization-based data analysis tool with inbuilt powerful statistics delivers immediate results and provides instant exploration and visualization of a wide range of omics data including miRNA.
miRNA data Analysis
miRNA (also written microRNA or µRNA) are non-coding RNA that are not translated into proteins. Instead they normally control the translation of mRNA. With Qlucore Omics Explorer, a researcher can easily examine and analyze data from miRNA (microRNA) experiments. Data can be generated either by NGS techniques or microarrays.
Key functionalities:
- Check data for outliers by visual inspection using sample Principal Component Analysis (PCA) plots.
- Remove unwanted factors (batches) with a single mouse click.
- Remove noise with variance filtering
- Perform statistical analysis using for instance ANOVA.
- Use hierarchical clustering, PCA or UMPA to indentify subgroups.
- Generate discriminating miRNA based on a selection of statistical tests.
- Visualize data with any of the 15 built in plots
- Export data and plots with the press of a single button.
Does it work on my data?
Answer the four quick questions below and find out if you can use Qlucore on your data.
For more details about supported data formats and data import see Data Import or Contact us with questions.
Case studies
Qlucore analysis of transcriptomic data
University of Manchester, UKThe study includes working with data from more than 400 arrays. Visualization is used in the effort to understand the human growth process.
Protein data analysis in Hepatitis studies
Institute Pasteur, FranceUnderstanding viral signatures in Hepatitis C. Qlucore Omics Explorer is used to identify differences in chemokines between the virally infected groups.


