
Features
The base module includes all the essential features scientists rely on for multi-omics data analysis, including both bulk RNA-seq and proteomics.
The NGS Module extends functionality with a comprehensive set of tools and methods for genome browser–centric analysis. All features are available in both cloud and local installations, ensuring flexibility across environments.
Users and data
Our carefully designed features make the program exceptionally easy to use. Feedback from users highlights the added value of Qlucore Omics Explorer, including:
- by improving the speed of analysis by up to 50%
- by stimulating creativity to explore new ideas and to discover new findings
The current user base spans a wide range of professions, from bioinformaticians, biologists, statisticians, and chemists to medical doctors, students, and professors. The program integrates publicly available resources such as datasets, gene ontologies, pathways, and other systems biology information to maximize analytical output. It is compatible with a broad spectrum of omics data types, for example:
Feature overview (Qlucore Omics Explorer 3.11)
You reach all key functionality with one or two mouse clicks and the results of your actions are always presented to you in real time by a visual update. The visual approach makes it easy to publish results as well as working in teams.
Qlucore Omics Explorer (QOE) ships in a base module with an option to add a NGS module with extensive functionality for NGS data analysis. Detailed information about the NGS module features is presented in the NGS Module feature overview document. Key features are highlighted below:
- QOE works in full real time with both 2D and 3D presentations of all data. All plots are truly interactive, this includes the Genome Browser (NGS module) and PCA plots. The user is encouraged to explore the data by changing filters and parameters dynamically.
QOE uniquely combines powerful statistical analysis with instant visualization. Most actions are controlled with only one mouse click. - The integrated Biomarker Workbench is optimized for experiments and studies in the areas of drug development and biomarker discovery.
- The powerful statistical framework supports a wide range of tests both for count data (DESeq2) and other types of data including, but not limited to, Wald, Likelihood ratio test, t-tests, Welch, ANOVA, paired tests, Two-way ANOVA, linear/quadratic/rank regression and a suite of nonparametric tests. Further supported by Independent Filtering and fold change. The tests can be further customized using eliminated factors and restrictions.
- QOE provides simple workflows for mRNA, miRNA data, protein, metabolomics and DNA Methylated data with direct import and normalization of Olink, Agilent, Thermo Fisher (Affymetrix) data and aligned BAM files for RNA-seq data. The NGS module supports a wide range of options for NGS data including Fusion gene analysis, ChIP-seq and ATAC-seq data.
- Survival analysis with Kaplan-Meier plots and Cox proportional hazards model is supported.
- Data visualization using 17 different types of plots some examples are Volcano, Box, Scatter, PCA, UMAP and Violin.
- Machine learning based classifiers (predictors) can be constructed using any of the following methods: Boosted trees, Support Vector Machines, Random Forest and kNN.
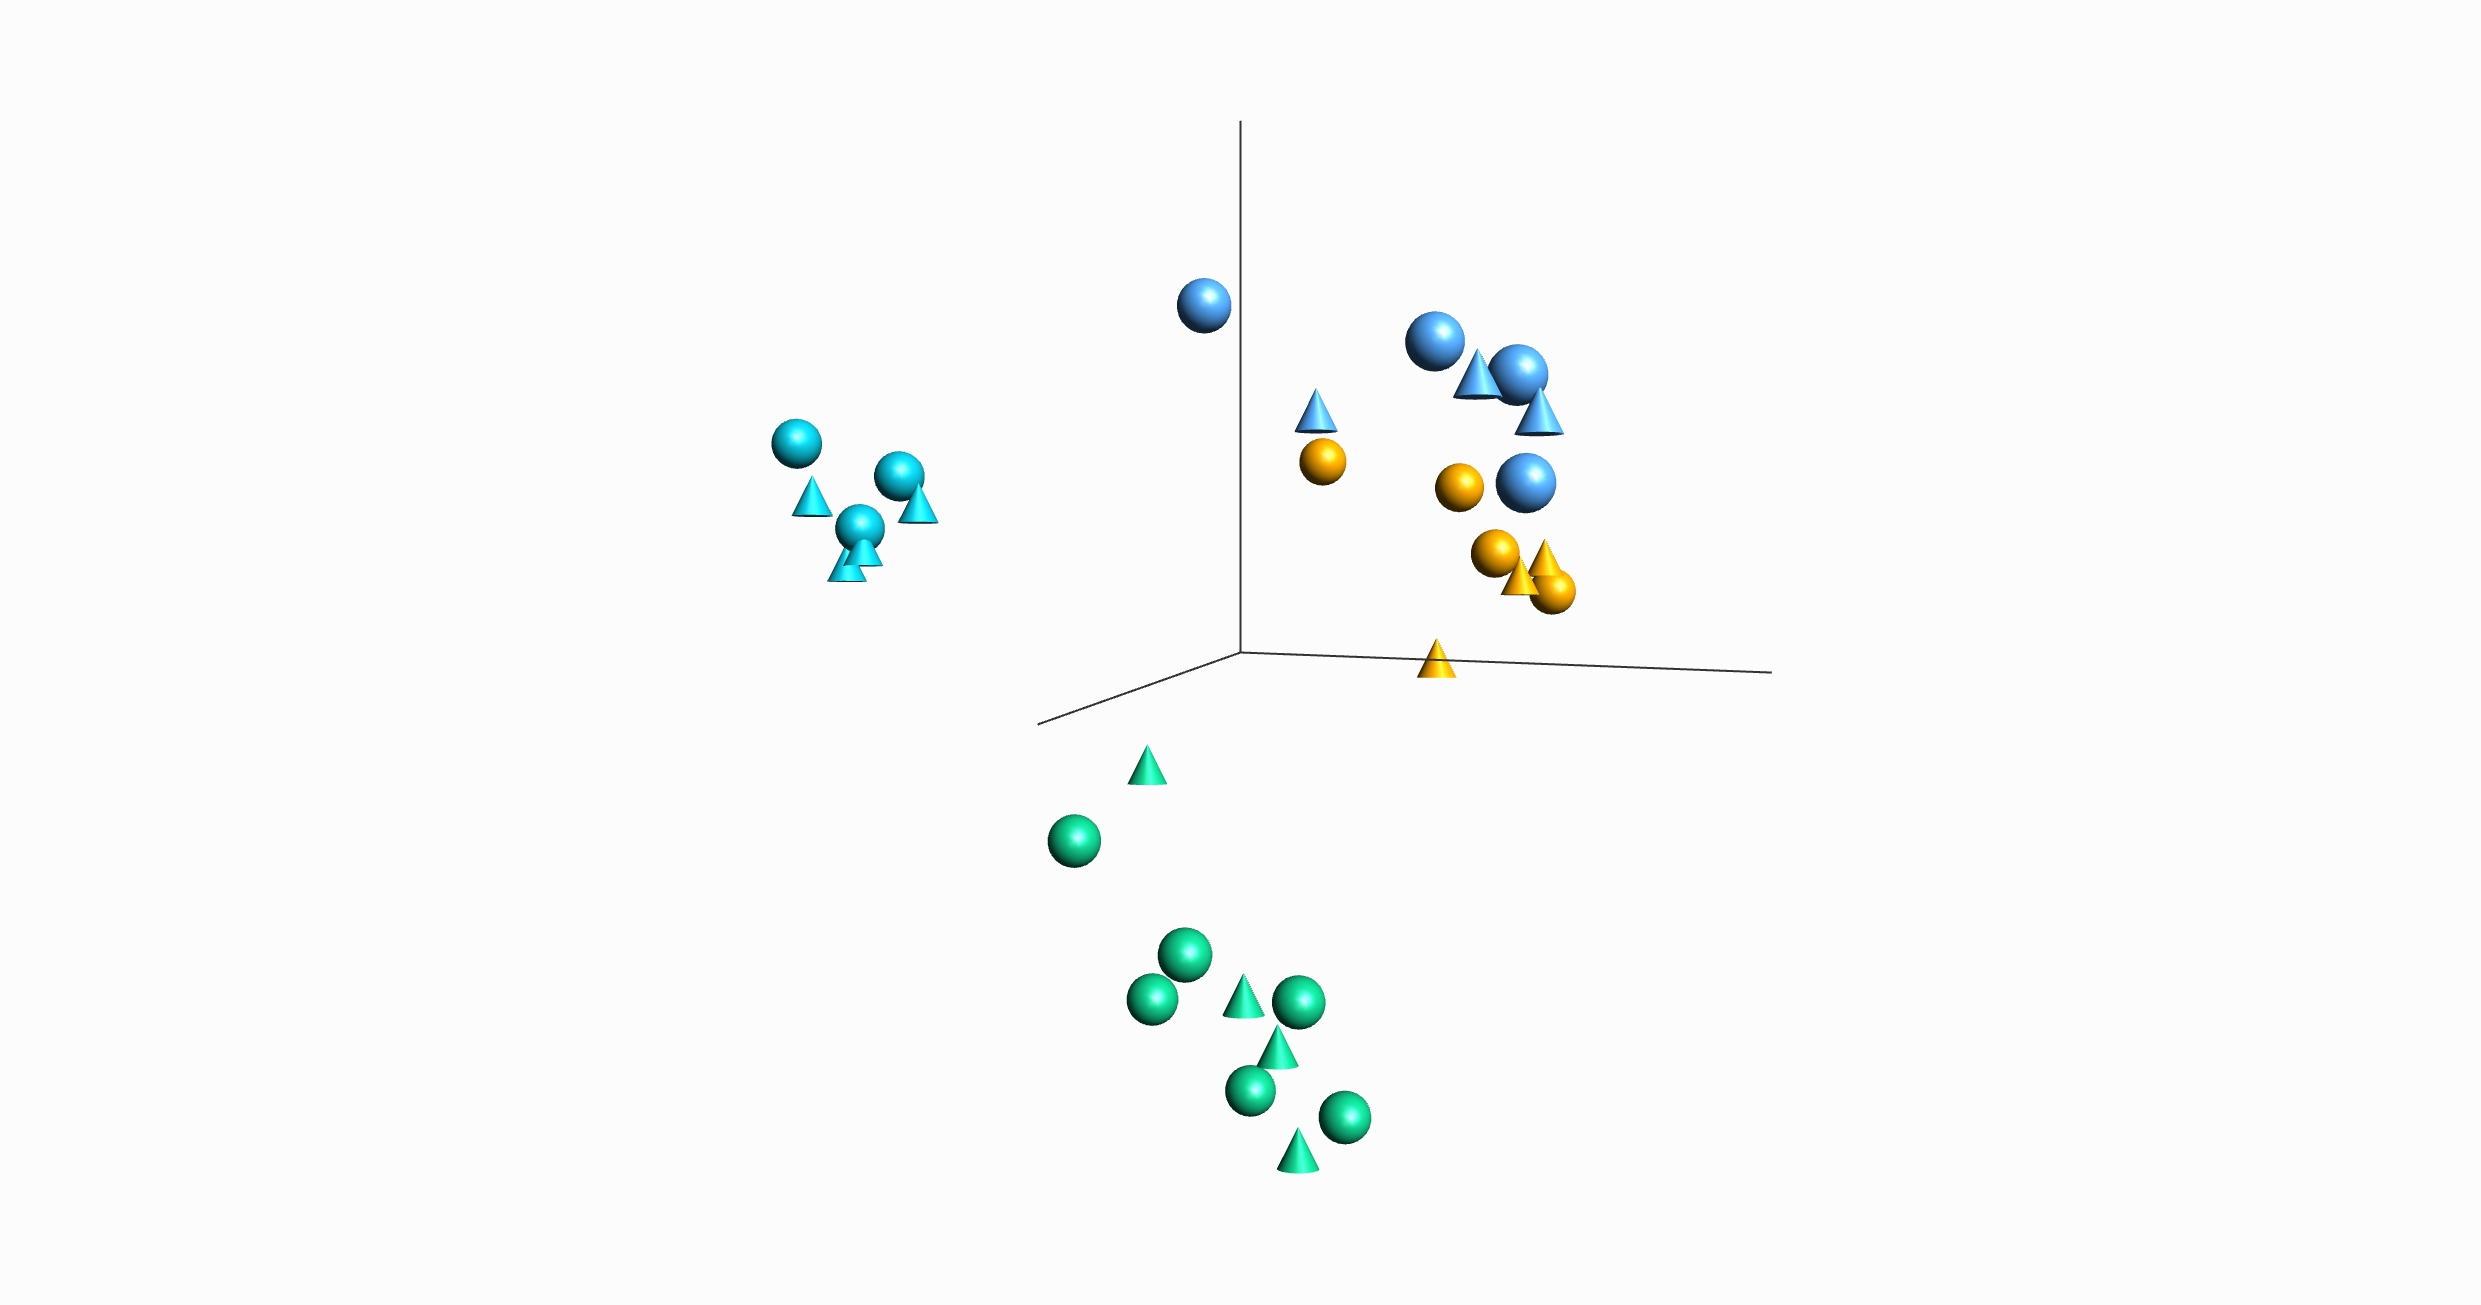
- Visualization of multiple annotations at the same time both in 2D and 3D plots such as PCA using a combination of colors and symbols.
- Scripting workflows is easy with Python based Templates. Extending functionality and integrating the program in tool chains can be achieved with the Templates.
- Analysis of single cell RNA-seq data is supported by features such as subsampling and t-SNE and UMAP plots.
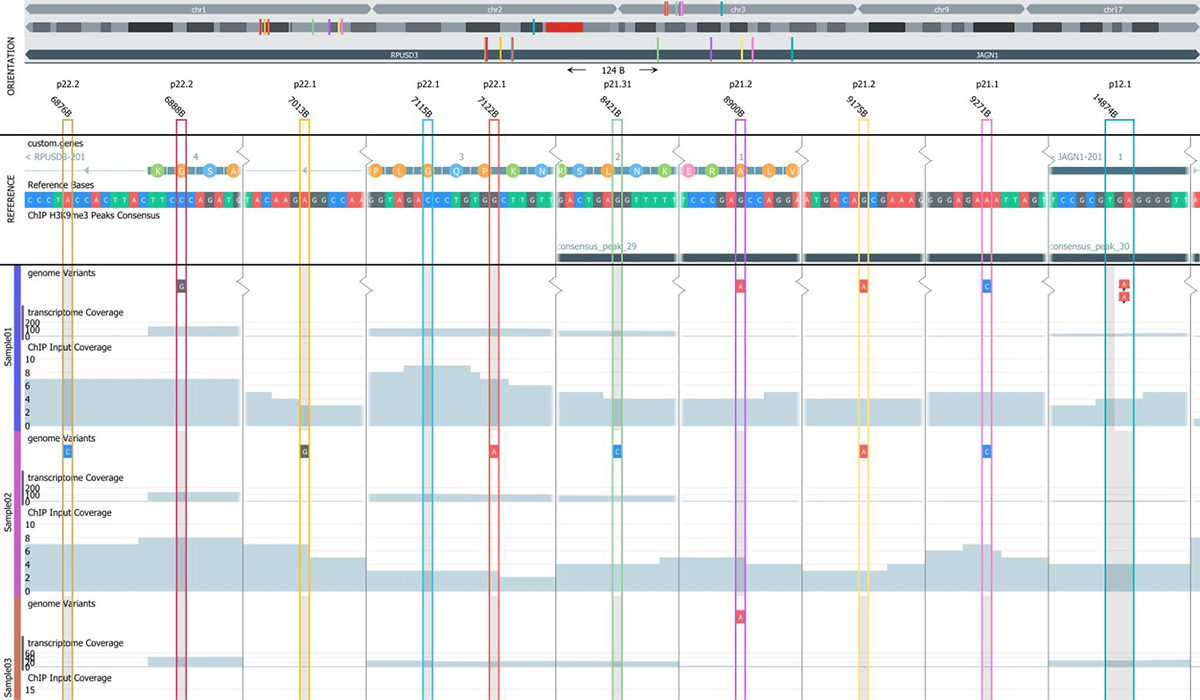
- The NGS module is centered around a dynamic Genome Browser which content is updated based on the filter settings. Filter on entities such as read coverage, Short indels presence or quality and genomic parameters of choice. Select and deselect samples to work with.
- With the NGS module the program offers a unique dual capability for RNA-seq data analysis. Work and filter with synchronized views, expression and genomic. Including Gene fusion Workbench and Circle plots.
- The integrated Gene Set Enrichment Analysis (GSEA) workbench allows a straightforward analysis of the biological context (pathways, ontology categories or any other relevant set of genes).
- QOE includes an open interface to R. Qlucore also provides free scripts for easy conversion to and from R data files.
- QOE supports hierarchical clustering, K-means clustering, heatmaps with dendograms and Dynamic Principal Component Analysis (PCA).
- A direct link to Gene Expression Omnibus (GEO) enables one button data downloads and easy comparison of findings with published material and with the GO Browser you can quickly search in ontologies.
- A Template tailored for TCGA data analysis is included.
- QOE only requires a normal computer to handle huge data sets (more than 100 million entries).
Key workflows
- Analyze and explore data set by a combination of visualizations and intuitive filters.
- Do statistical analysis using a wide range of built-in tests, such as DEseq2 and ANOVA and nonparametric tests, as well as through the open interface to R.
- Use the Biomarker workbench to run many statistical tests in batch mode including post hoc analysis.
- Import data and clinical annotations with easy-to-use Wizards.
- Pre-filter to remove unwanted variables.
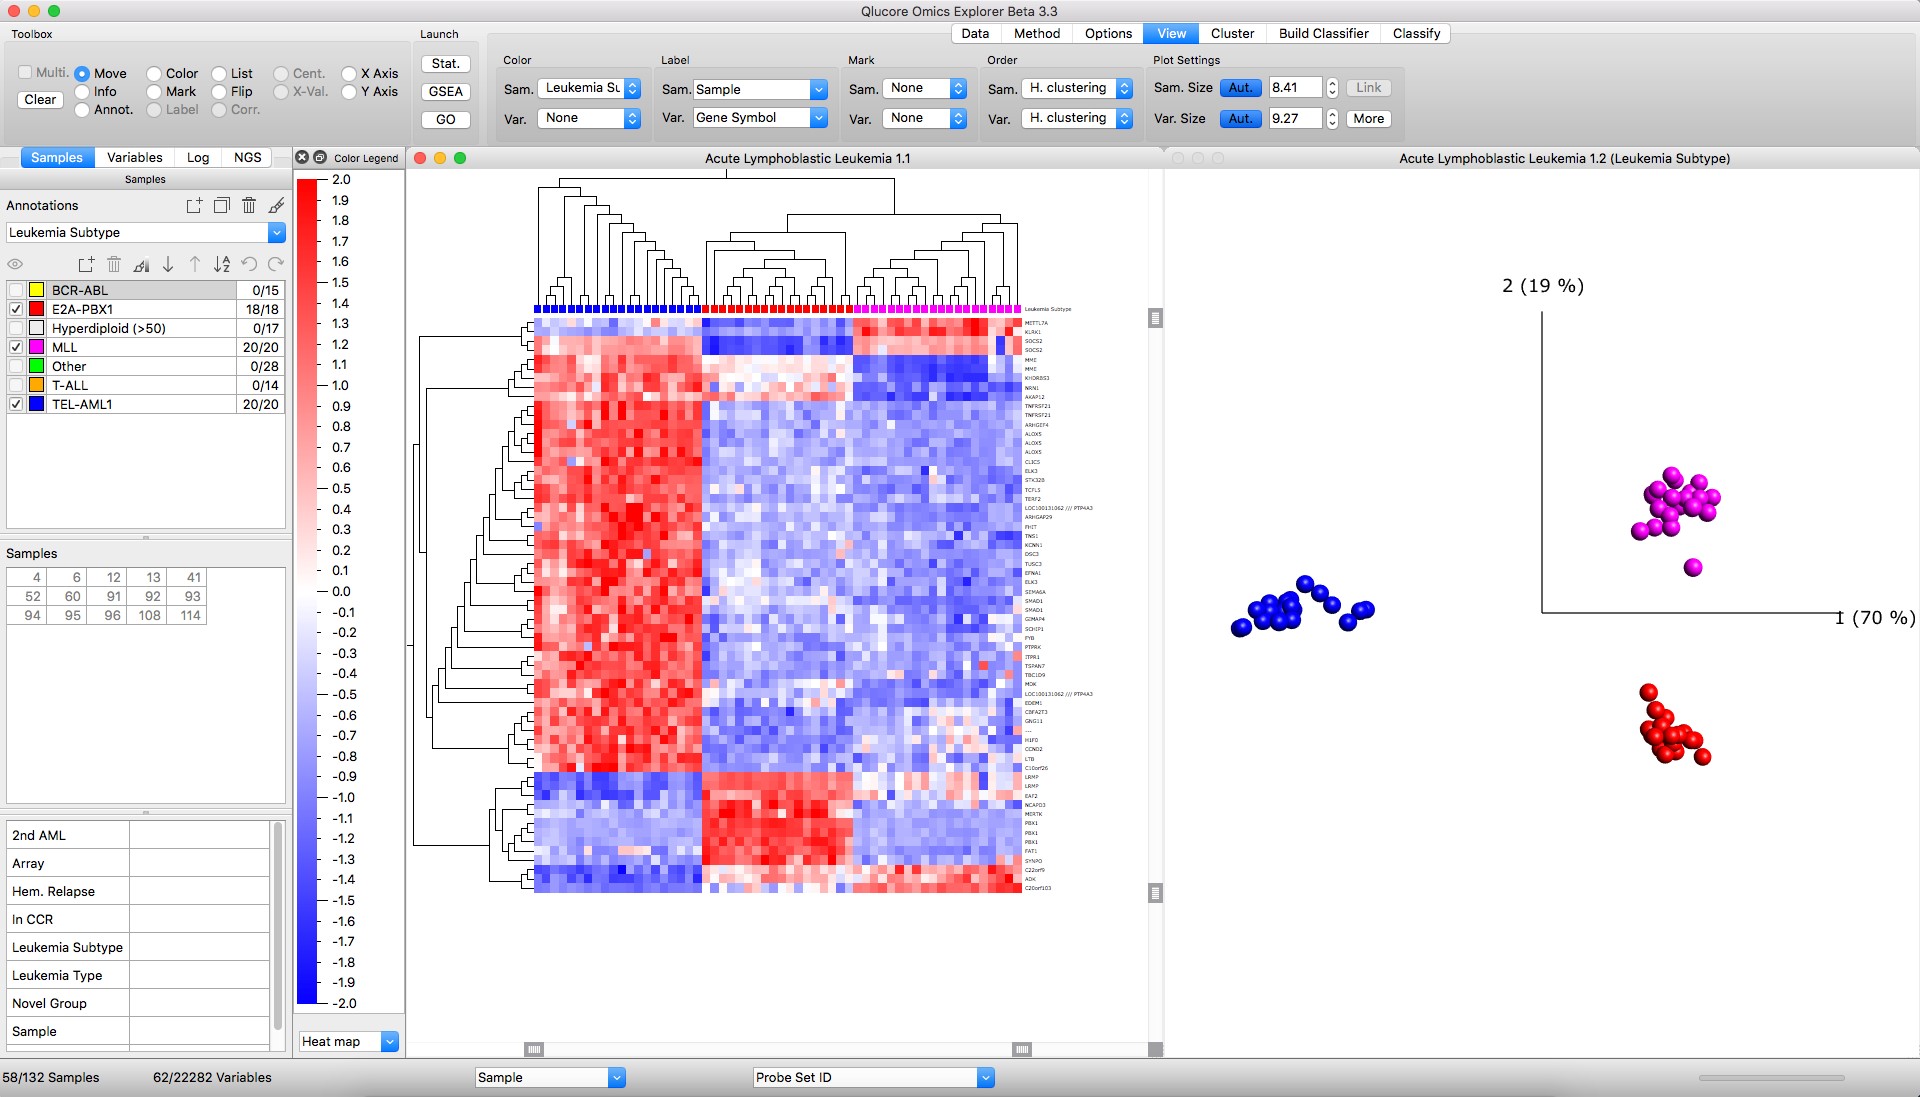
Figure: Left: Heatmap with hierarchical clustering Right: PCA sample plot
- Perform hierarchical clustering and generate dynamic heatmap plots.
- Analyze RNA-seq data both in the Genome browser and a PCA plot in a synchronized view. Analyze single cell RNA-seq data using t-SNE and UMAP plots.
- Fine tune and generate results using any combination of scatter, box, bar, line, volcano plots and Venn diagrams.
- Instantly create Principal Component Analysis PCA plots of large data sets and confirm the information content by using the Qlucore unique functionality Projection Score.
- Estimate dimensionality with Talus and Scree plots.
- Use unsupervised clustering based on K-means++ clustering and silhouette values.
- Use any of several methods, Hierarchical clustering, PCA, clustering, ISOMAP and or graphs for visual data exploration.
- Build classifiers and classify new samples.
- Do functional analysis in the context of public available gene sets such as pathways etc. using GSEA.
- Download data from Gene Expression Omnibus (GEO) and TCGA to compare your own results with published material.
- Remove unwanted dependencies such as artifacts and outliers. Manage batch effects.
- Benefit from the streamlined workflows for ThermoFisher (Affymetrix) gene expression microarray and Agilent miRNA and mRNA data as well as direct import of aligned BAM files with RNA-seq data for digital gene expression analysis.
- Execute and use templates for faster and easier start, repetitive tasks och integration with tool chains. Keep track of your work with powerful global log and restore function.
NGS Module feature overview (Qlucore Omics Explorer 3.11)
The Next Generation Sequencing (NGS) Module is an add-on module that will enable additional functionality related to analysis of data generated with NGS technologies and will make it possible to interactively and dynamically analyze and explore NGS data both from DNA and RNA.
All functionalities will be provided as integrated parts of Qlucore Omics Explorer and work with the well-known functionality.
The main components of the NGS Module are:
- An interactive and fast genome browser for many samples and many tracks per sample
- A genome filter control component
- A project manager for project set-up and definition of which files to include
- A built in variant caller for short indels and variants
- A Gene fusions workbench with Circle plot visualizations
Examples on supported analysis
- Variant detection and variant analysis
- RNA-seq expression data analysis
- Synchronized analysis of the genomic as well as expression levels
- Peak analysis (ChIPseq and ATAC seq)
- Single cell RNA-seq
- Fusion gene analysis
Interactivity
The NGS module is unique in providing true interactive and dynamic analysis of NGS data. The Genome Browser content is dynamically updated when filters and filter cut-off are changed, for instance using sliders and check-boxes.
Workflow and data storage
One unique feature of the NGS Module is the two-stage workflow. The first stage is a pre-processing step that prepares data for the fast and interactive analysis in stage two.
The project files and associated data for indexing samples is stored locally on the user’s computer to secure fast access and interactivity while files such as large BAM files can be stored anywhere on a network.
RNA-seq analysis
The options available for RNA-seq analysis are impressive. Utilizing the existing functionality in QOE for expression data and combining it with the new NGS functionality enables significantly increased analysis options. When a RNA-seq project is initiated, both quantitative normalized expression levels will be calculated at the same time as data is prepared for the genome browser. The program is built to seamlessly handle information both from a quantitative and genomic view. As an example, the user can define discriminating genes with a t-test, visualize them in a heat map and study the genes in the genome browser. If a sample group is selected or de-selected all plots will be updated and the
analysis can directly continue.
Peak analysis
The peak analysis support in Qlucore Omics Explorer allows for comprehensive analysis of peak data such as ChIP-seq and ATAC-seq. The main components of the peak analysis processing are peak detection, consensus peaks and count matrix generation. The genome browser includes powerful filtering options for peak analysis, making it easy to find interesting features. The browser allows the user to annotate peaks and export the results as a bed file. If the experiment also includes RNA-seq data, it is possible to generate a count matrix for RNA-seq and swap between the RNA-seq and ChIP-seq count matrices during the analysis.
Gene Fusion analysis
The Gene Fusion Workbench is shipped with the Mitelman reference data base. By combing filters of various types such as presence in the reference data base and quality, detection of both novel and well-established fusions is straightforward. The fusions can be thoroughly examined in the genome browser and visualized in the Circle plot for a great overview.
Read more about Next Generation Sequencing.
Feature documents
Qlucore Omics Explorer feature overview
Qlucore Omics Explorer (QOE) is developed to enable fast, easy-to use and visual analysis of measured data from a very wide range of sources and instruments transforming data into insights considering publicly available information such as TCGA data, gene ontologies, pathways and other system biology information to maximize the results and impact.
Qlucore Omics Explorer NGS Module feature overview
Qlucore Omics Explorer (QOE) supports the user with fast, simple and visual analysis of
measured data. The NGS Module is an add-on module that will enable additional functionality
related to data generated with NGS technologies and will make it possible to interactively and
dynamically analyze and explore NGS data both from DNA and RNA.