Volcano plot
Volcano plots are one of the many types of visualization that is included in Qlucore Omics Explorer. The program is a next-generation bioinformatics software for research in life science, biotech, food and plant industries, as well as academia. The powerful visualization-based data analysis tool with inbuilt powerful statistics delivers immediate results and provides instant exploration and visualization of multi-omics and NGS data.
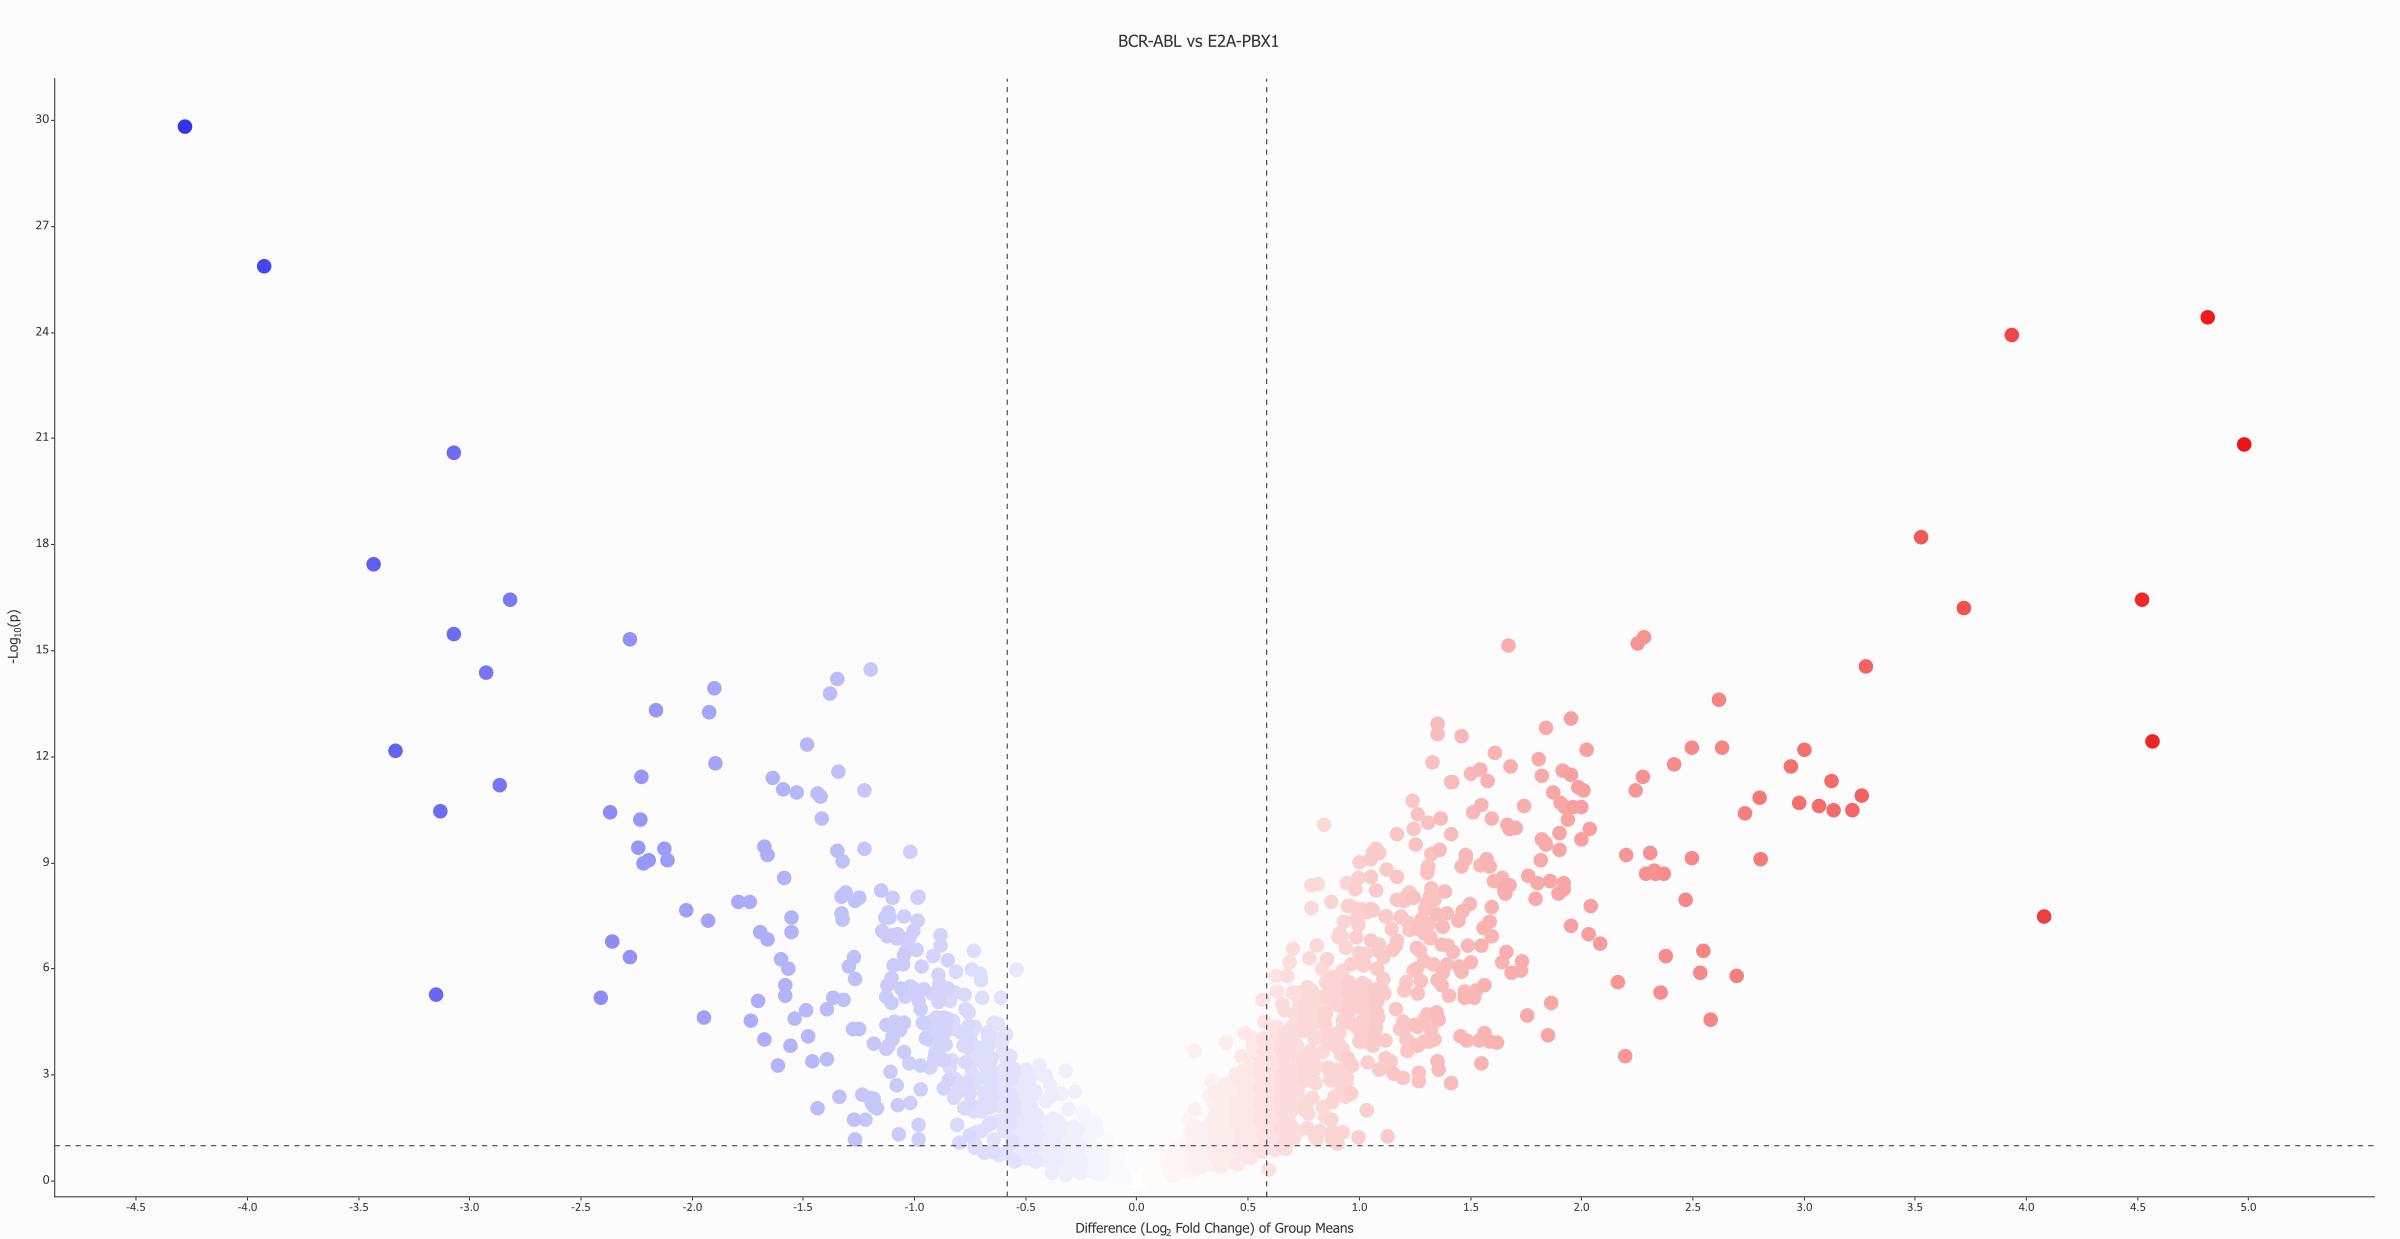
Volcano plot software
With Qlucore Omics Explorer you have extensive freedom on how to analyze and visualize your data. One option is the volcano plot that is easily configured to your needs, when it is ready the plot can be exported in several ways for inclusion in reports and publications.
Continuous overview and interaction with data and analysis
The Volcano plot separates and displays your variables in two groups - upregulated and downregulated (based on the test you have performed. The plot is interactive and will instantly update if you change the p-value or fold change cut-off. Extensive coloring options will assist you in highlighting your preferred genes, you can also label them and create a list of genes directly from the plot. It is straightforward to configure plots for a layout that will meet your requirements and those of a potential reviewer.
The Volcano plot works in perfect harmony and synchronization with all other plot types, such as heatmap, Venn, PCA, box, bar, genome and scatter plots.
Does it work on my data?
Answer the four quick questions below and find out if you can use Qlucore on your data.
For more details about supported data formats and data import see Data Import or Contact us with questions.


