t-SNE Plot
Qlucore Omics Explorer is a next-generation bioinformatics software for research in life science, biotech, food and plant industries, as well as academia. The powerful visualization-based data analysis tool with inbuilt powerful statistics delivers immediate results and provides instant exploration and visualization of big data, for instance with a t-SNE plot.
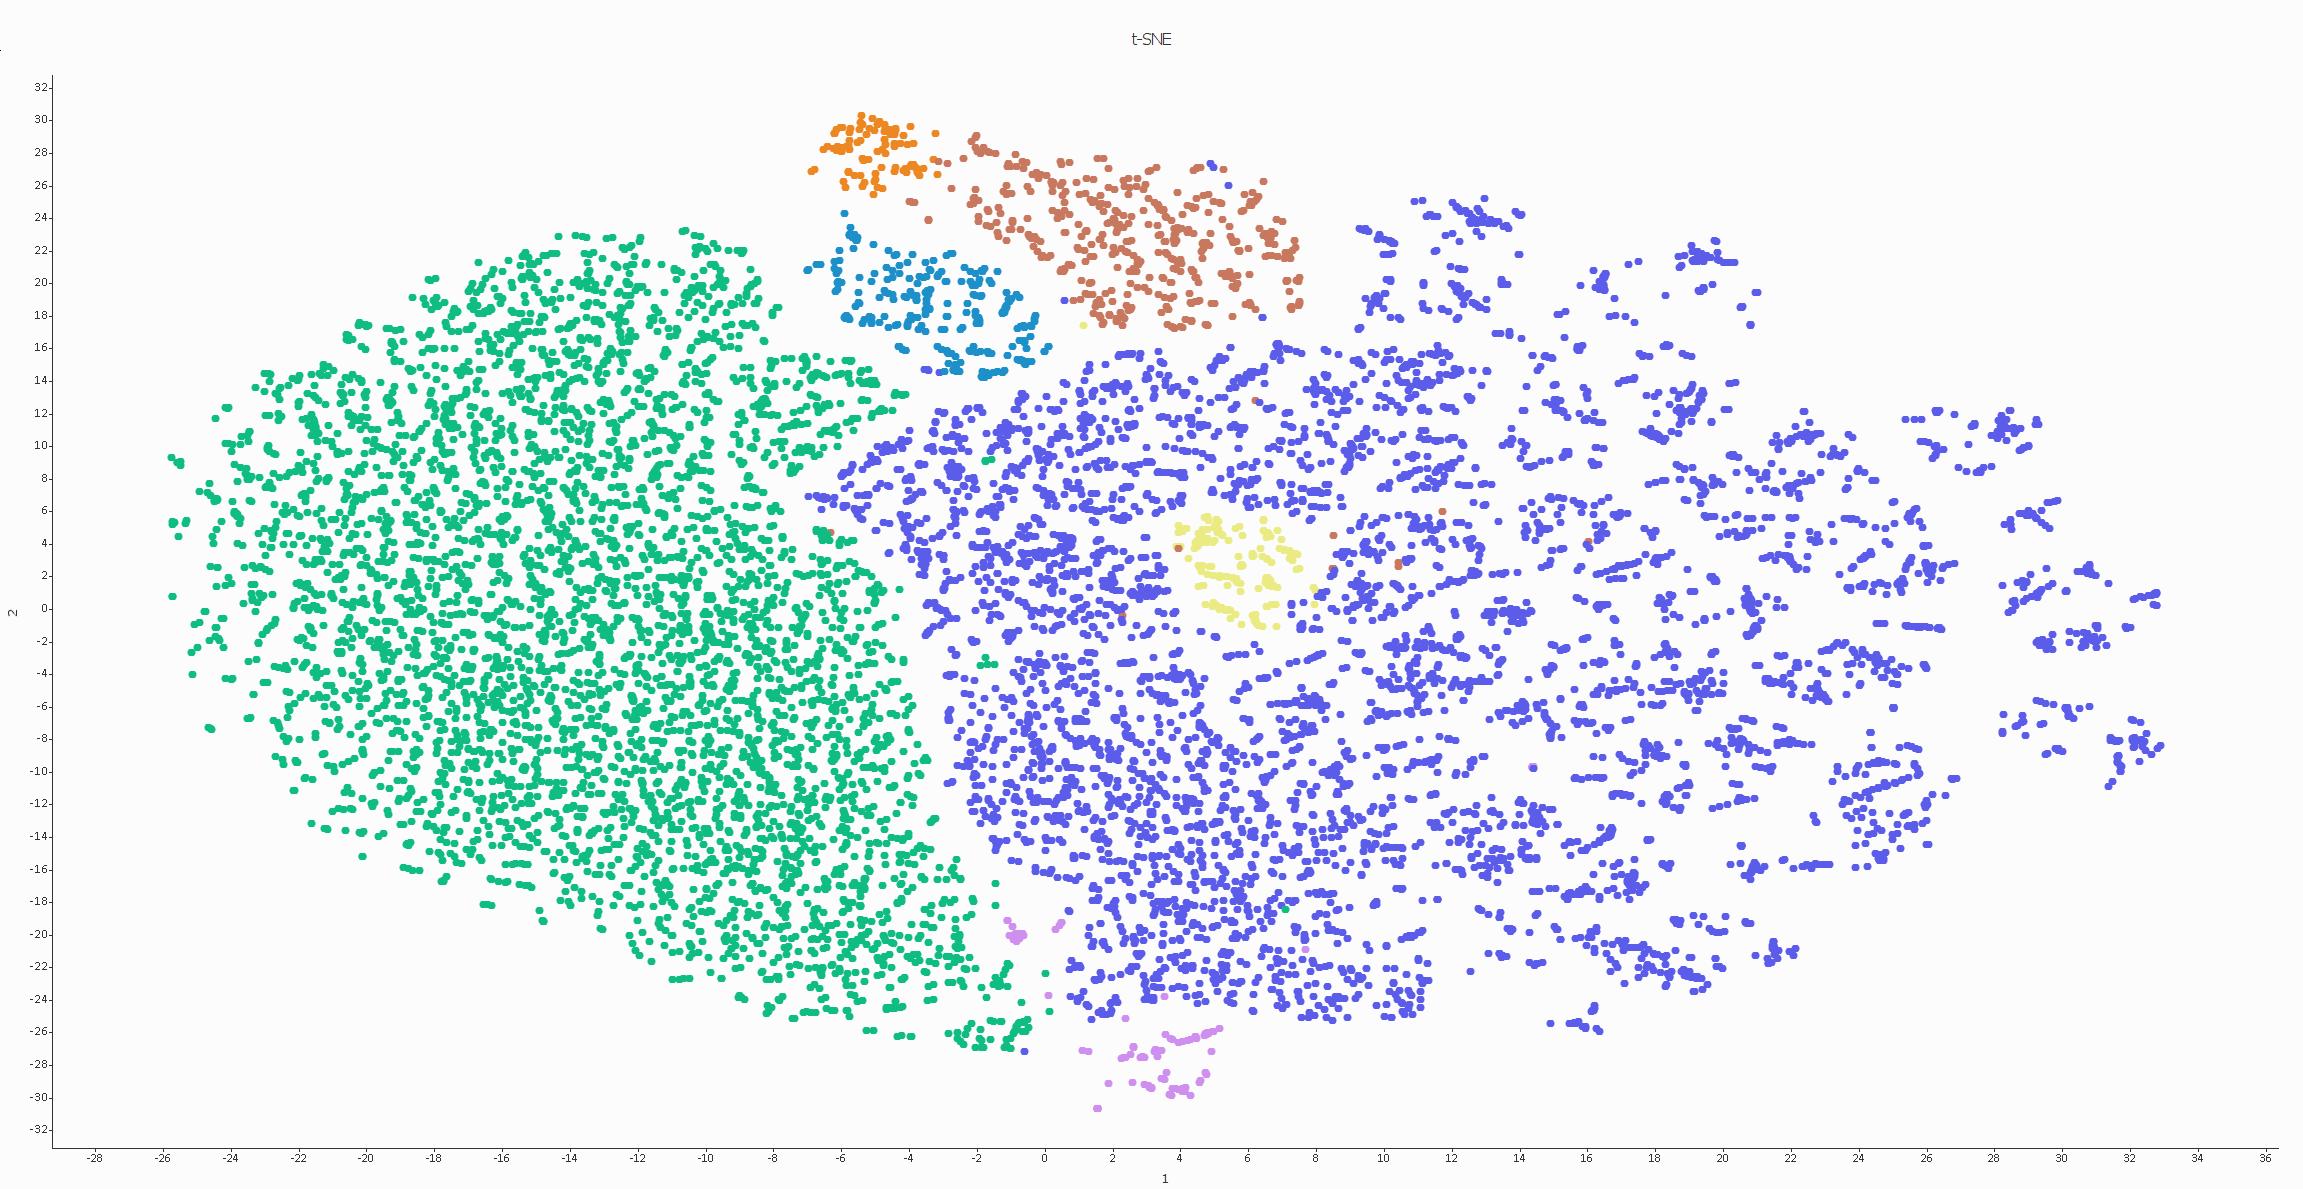
Use t-SNE plots to identify structures
The t-SNE plot support is complete and versatile. With direct access to the perplexity parameter and full integration with other plot types, the t-SNE plot complements other tools such as PCA plots and ISOMAP. When working with single cell data the coloring option can be very helpful. With it you can color cells/samples in the t-SNE plot according to the expression of one or several genes, which can assist you further in identifying cell type populations.
The rich suite of tools aids you in even more advanced searches for structure and patterns. The UMAP plot provides you with yet another powerful exploration tool.
Single cell RNA-seq made easy
Qlucore Omics Explorer supports a complete workflow for single cell RNA-seq data, where the t-SNE plot is one of the components. Other useful functions are PCA plots UMAP plots, k-means++ clustering and subsampling as well as variable pre-filtering.
Read more about single cell RNA-seq.
Watch video and learn more

Does it work on my data?
Answer the four quick questions below and find out if you can use Qlucore on your data.
For more details about supported data formats and data import see Data Import or Contact us with questions.


