


VIDEO and FREE TRIAL
Qlucore Omics Explorer video
Qlucore Omics Explorer free trial
Qlucore Omics Explorer is a next-generation bioinformatics software for research in life science, biotech, food and plant industries, as well as academia. The easy to visualization-based data analysis tool with inbuilt powerful statistics delivers immediate results and provides instant exploration and visualization of multi-omics and NGS data. Create and generate Venn diagrams with a few mouse-clicks.
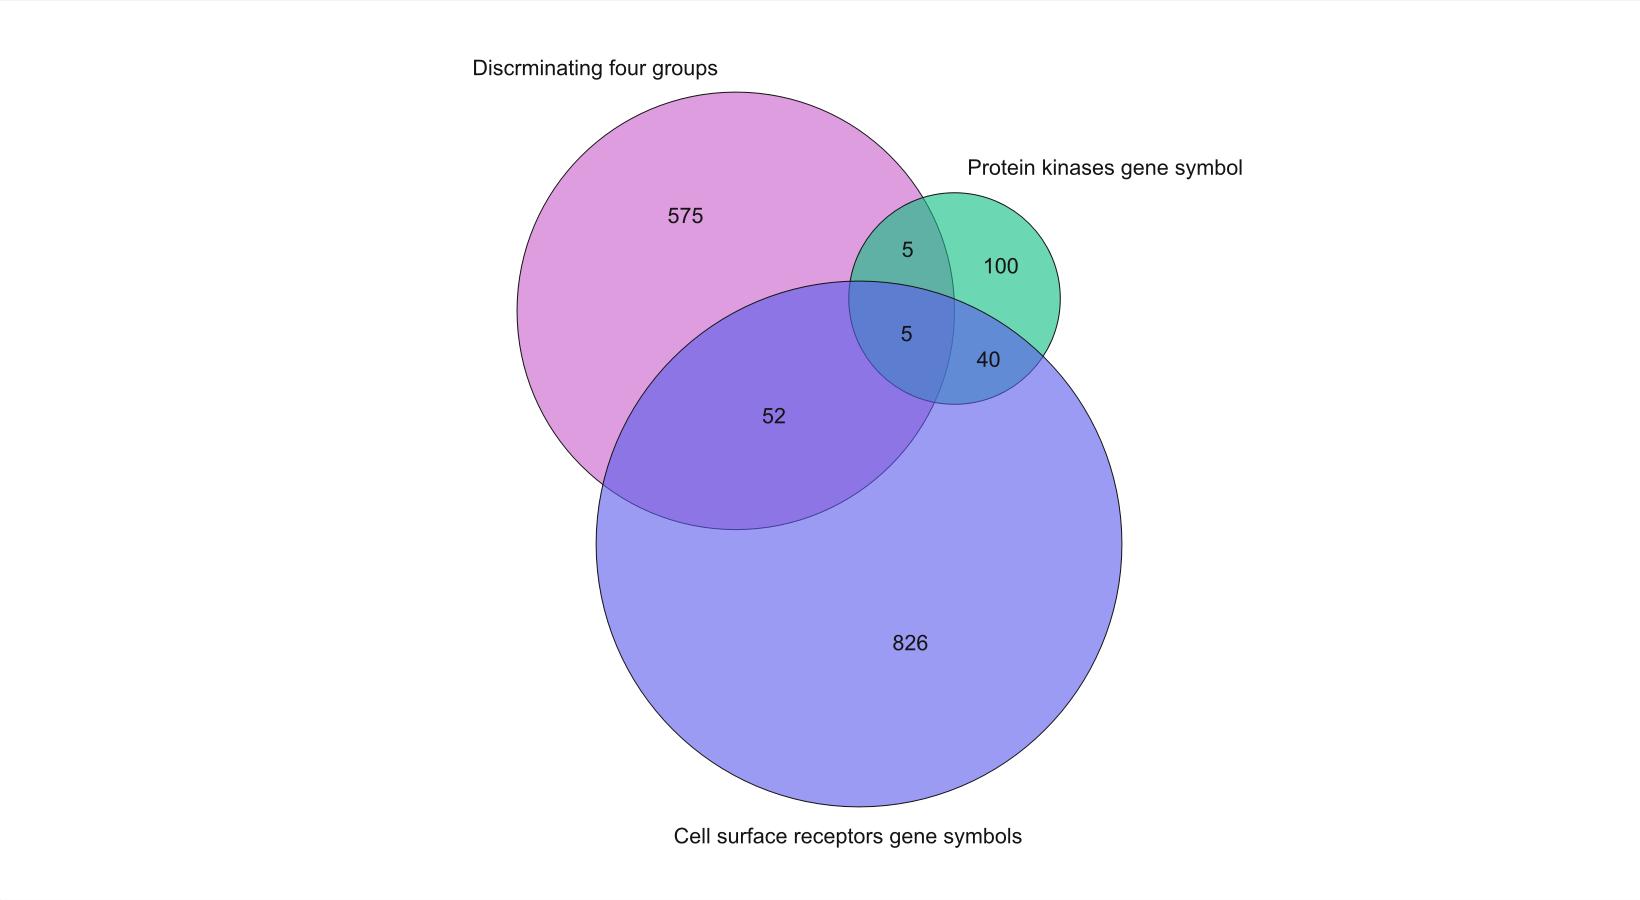
One of the available plots that is easy to create and generate in the program is the Venn diagram. The Venn diagram is an excellent way to create and visualize overlap and interaction between lists.
Conducting analysis and using the program you tend to create many variable lists as you progress your work towards actionable new results. Your lists capture important results and include variables (genes, proteins, metabolites etc). With a few mouse clicks you create and generate a Venn diagram adjusted to your visualization needs.
In the Venn diagram you can easily select any of your lists and visualize the interactions, identifying interesting overlaps, differences etc. The plot is easy to configure, and you can work with up to four lists at the same time.
Venn Diagram lists generation
By clicking in a Venn diagram plot a list with the variables from the clicked area is generated and directly available in the variable tab for further use and download. This enables very flexible and time saving workflows.

Answer the four quick questions below and find out if you can use Qlucore on your data.
For more details about supported data formats and data import see Data Import or Contact us with questions.