Bioinformatics software and data analysis
Fast, Visual and user friendly bioinformatics software for multi-omics and NGS data.
Bioinformatics software
Qlucore Omics Explorer is an easy-to-use bioinformatics multi-omics data analysis software. The powerful visualization-based data analysis tool with inbuilt powerful statistics delivers immediate results and provides instant exploration and visualization of big data. A broad spectrum of Omics and NGS data types are supported and easily imported.
Perform data analysis
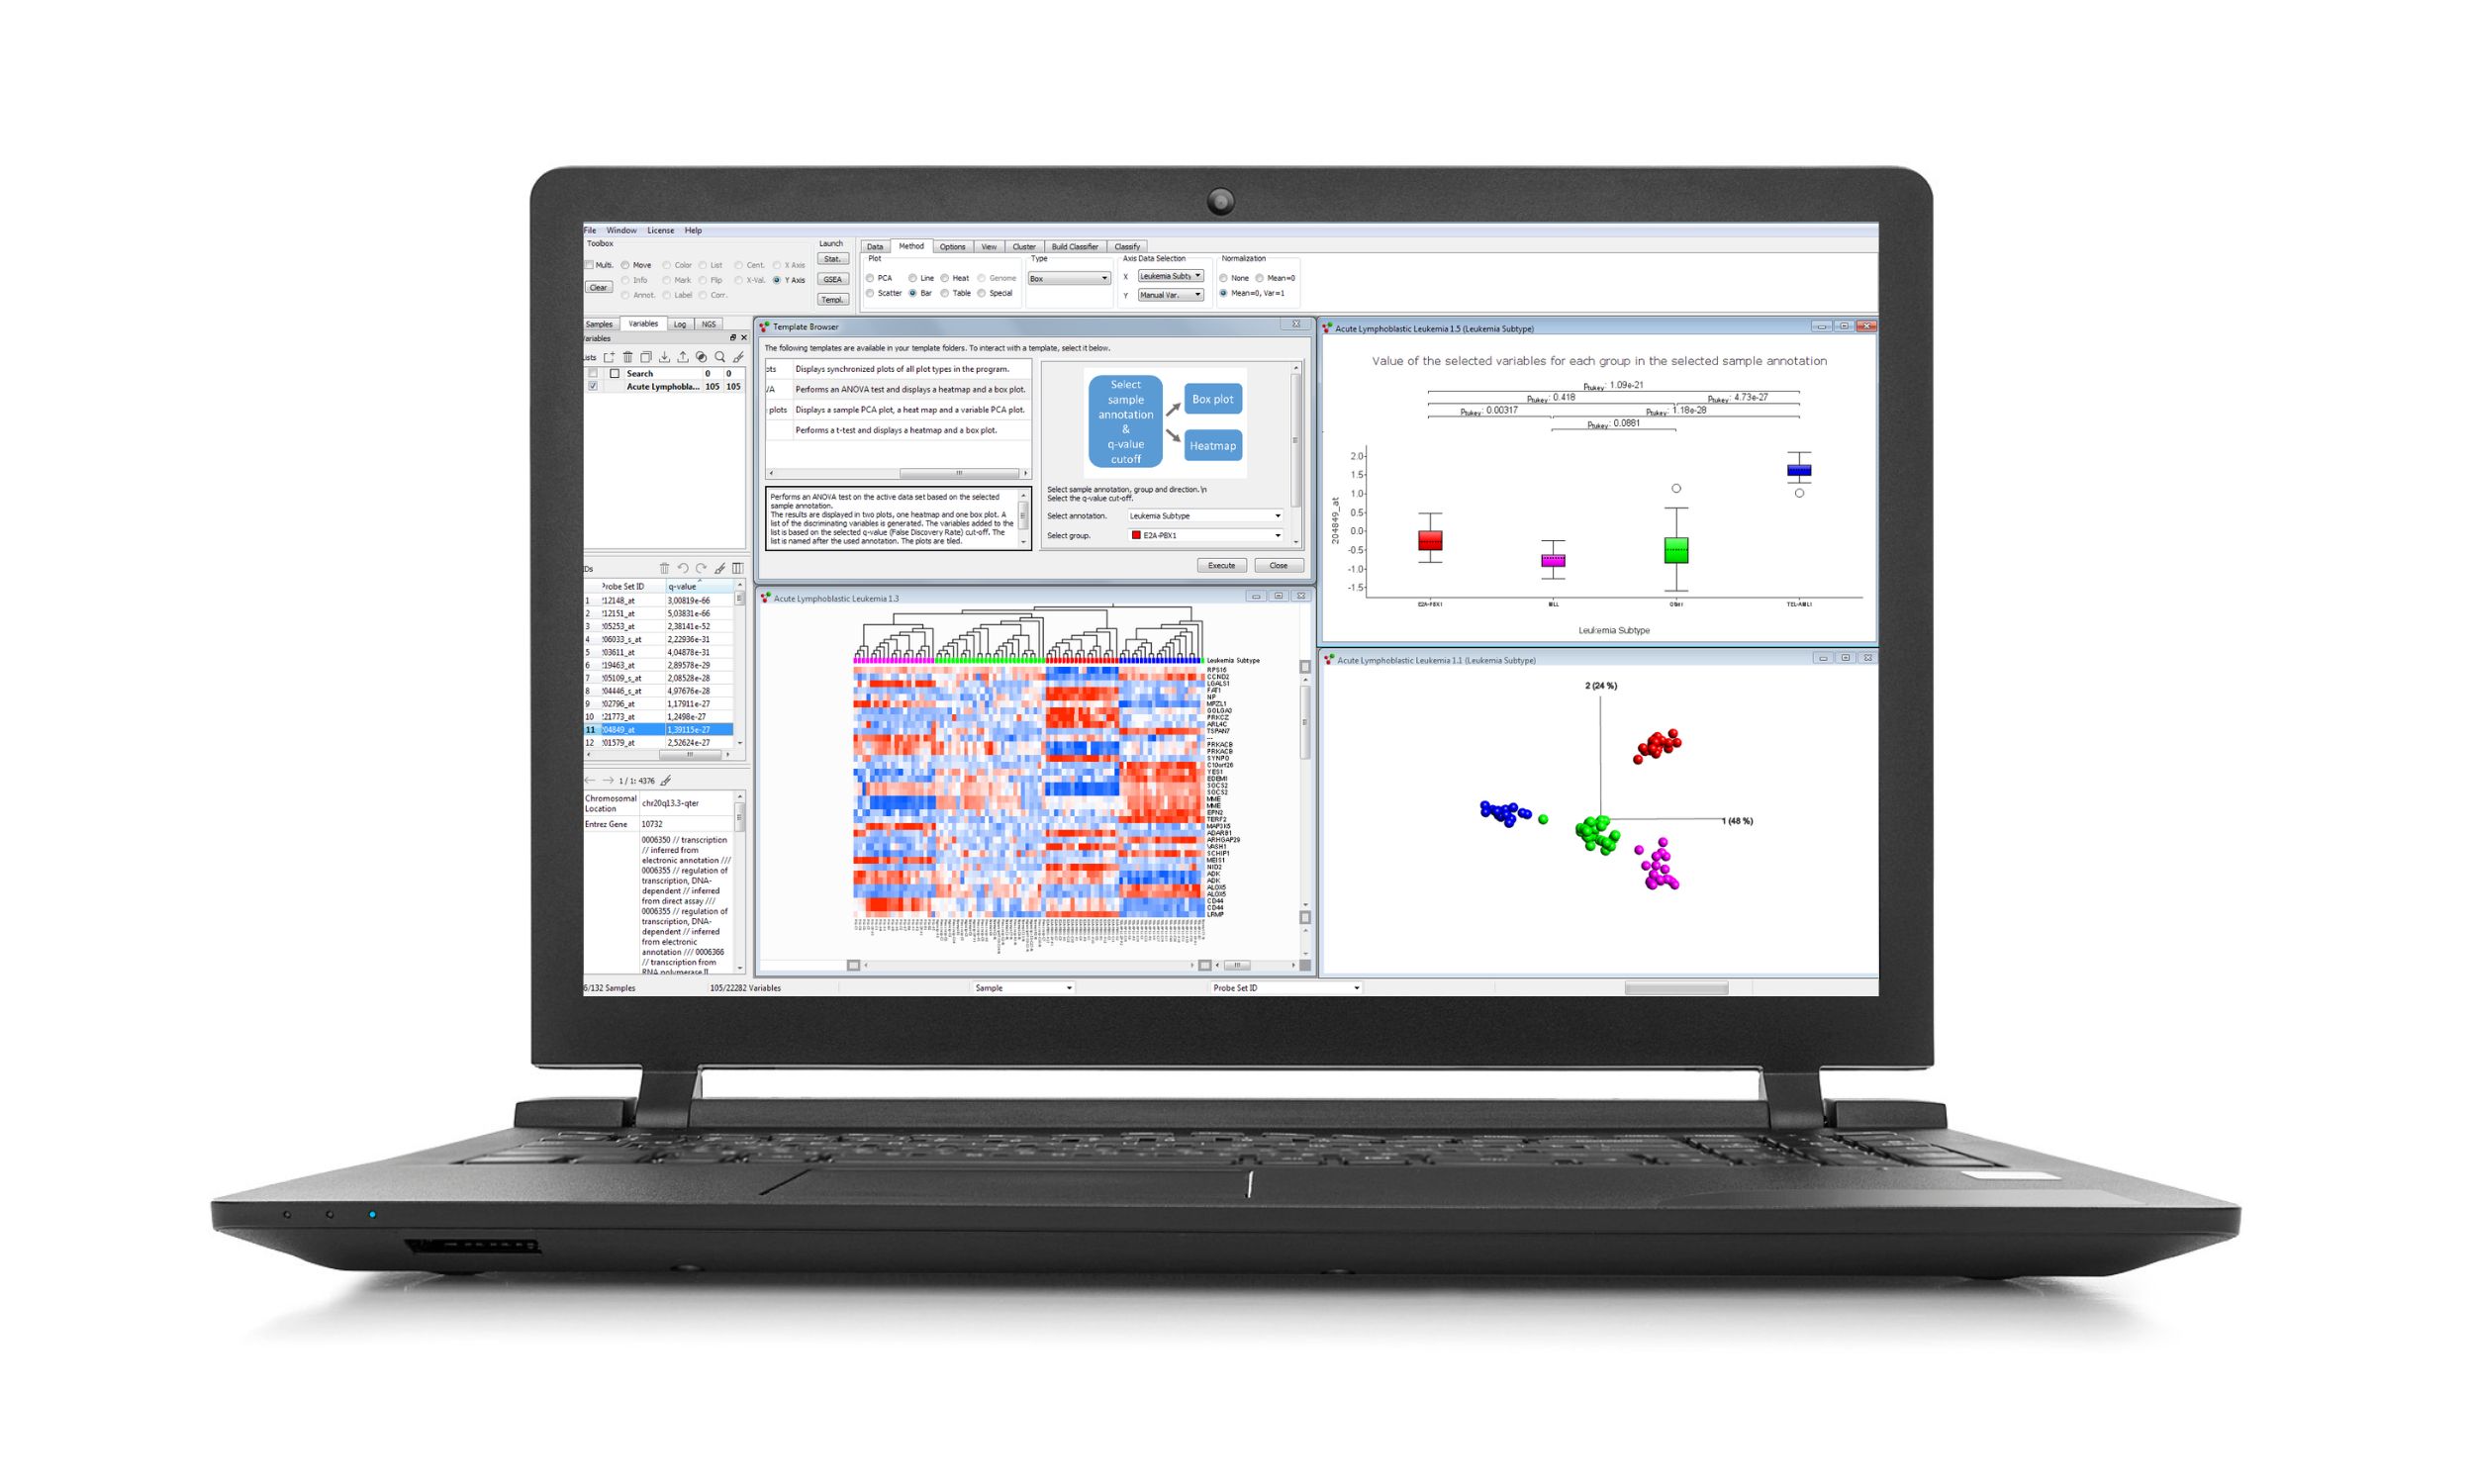
The bioinformatics software supports many different types of omics data such as gene expression (microarray, RNA-seq, single cell), proteomics, metabolomics, miRNA, qPCR, Flow cytometry etc. With the NGS add on module analysis along the genome is supported with the fast Genome browser.
The program is powerful and can be used both by bioinformaticians as well as biologists, chemists or other scientists with multi-omics data. What is even better, it can be used in collaboration spanning over diverse expertise areas.
Data analysis and visualization using statistical methods for continues as well as count-based data can quickly and easily be performed. Analysis starts with data import and normalization, and the program supports many different file types and normalization. No scripting or programming is required to set this up, but possible as an extension. Results are updated in real time in many different plot types such as PCA, heatmaps, t-SNE, UMAP, box, scatter, volcano, Venn diagram, Kaplan Meier, Violin plots etc.
Supported Bioinformatics analysis:
- Statistical analysis - The powerful statistical framework supports a wide range of tests including, but not limited to, DESeq2 (Wald, LRT, Independent filtering), t-tests, ANOVA, paired tests, Two-way ANOVA, linear/quadratic/rank regression, Welch, Kruskal-Wallis and Mann-Whitney.
- Fold change and difference.
- Biomarker discovery analysis - using our Biomarker workbench optimized for experiments and studies in the areas of drug development and biomarker discovery.
- Genome analysis – with the NGS module. Filters and easy to use navigation tools make it possible to dynamically investigate specific regions of the genome.
- Statistical tests can be further customized using eliminated factors and restrictions.
- Cluster analysis - either use a semi-supervised mode using PCA, t-SNE or UMAP, with Projection score and variance filtering or an unsupervised mode using kmeans++.
- Survival analysis using methods such as Hazard ratio calculations as well as visualizations in Kaplan-Meier plots.
- Peak detection – with the NGS module. Detect peaks and generate counts for ChIP-seq and ATAC-seq data, find matching genes and dynamically investigate specific regions of the genome.
- Gene fusion analysis with the integrated Gene fusion workbench which is part of the NGS module.
- Pathway analysis - compare and enhance your findings use the integrated GSEA Workbench which is set-up using only a few mouse-clicks.
- Classification and machine learning – enables both the option to easily build classifiers based on models such as Boosted trees, Support Vector Machines (SVM), Random Trees (RT) and kNN and to classify new samples.
Read more and choose your preferred application area.


