Simplify your GSEA and Pathway Analysis
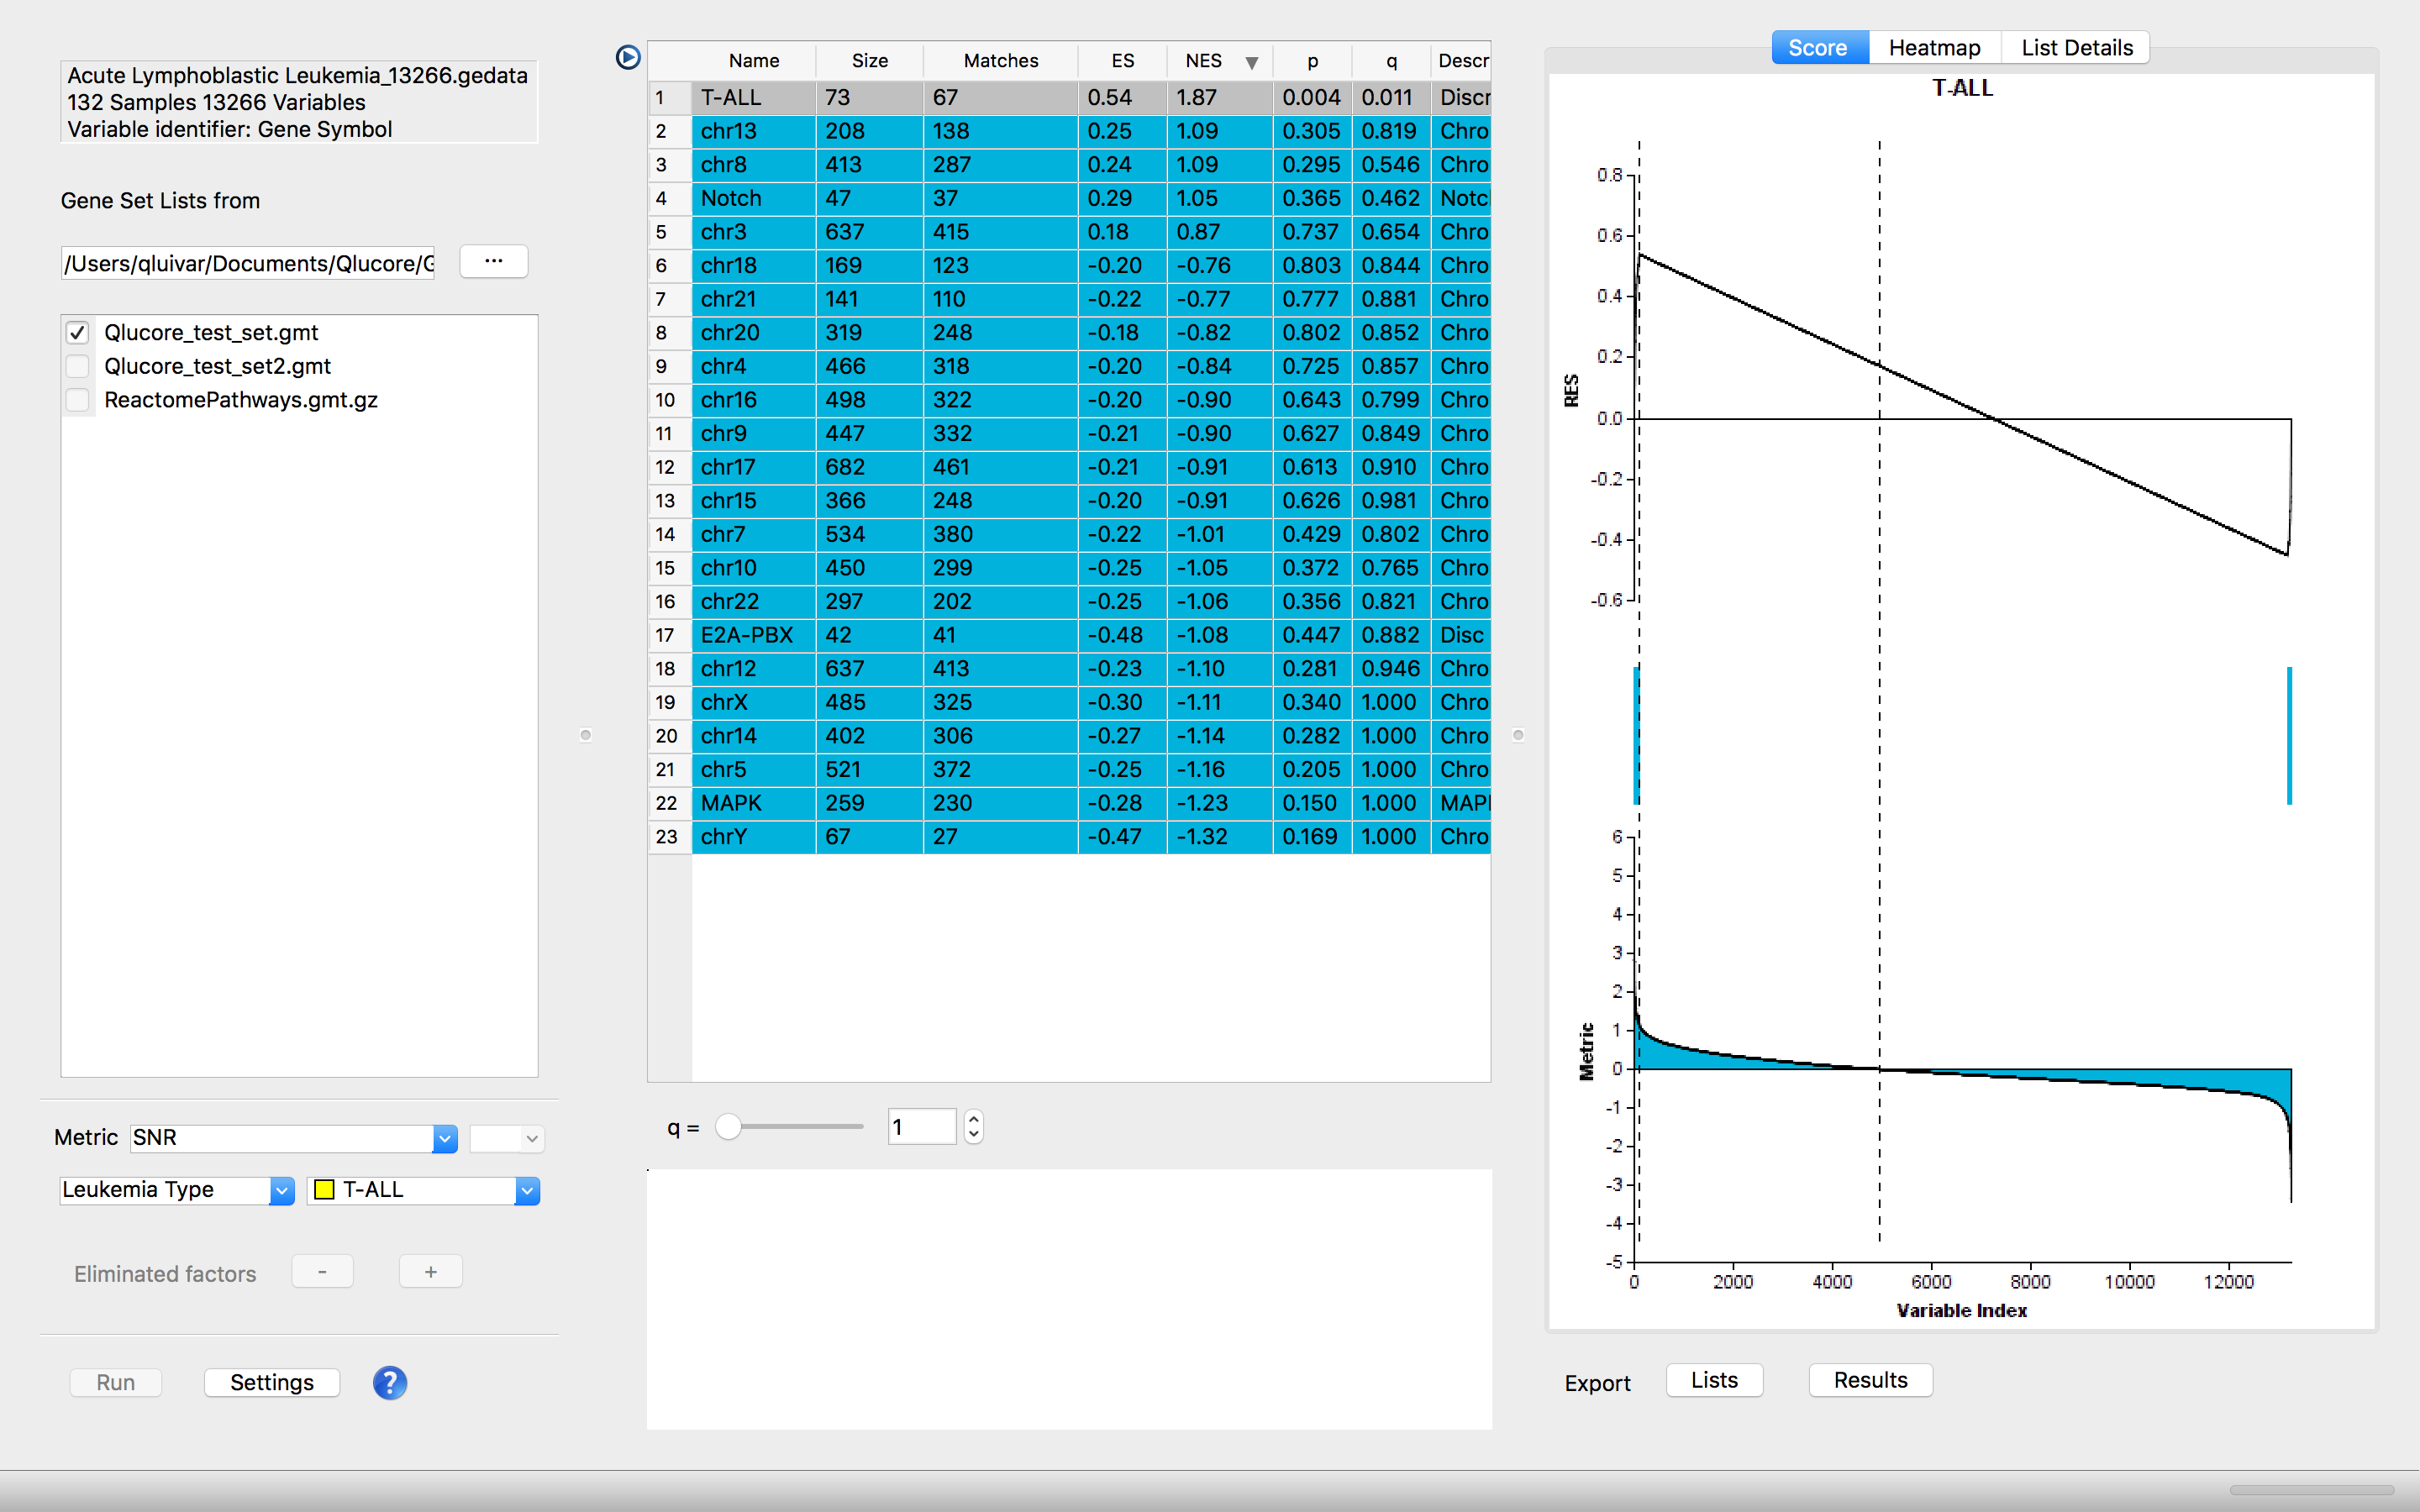
Qlucore Omics Explorer is an easy to use visualization-based data analysis tool with inbuilt powerful statistics that delivers immediate results and provides instant exploration and visualization. The program supports a broad spectrum of Omics and NGS data.The integrated and always available Gene Set Enrichment Analysis (GSEA) Workbench allows straightforward analysis of the biological context (pathways, ontology categories or any other relevant set of genes).
Integrated GSEA Workbench - a GSEA Software
The integrated Gene Set Enrichment Analysis (GSEA) Workbench allows straightforward analysis of the biological context (pathways, ontology categories or any other relevant set of genes).
Compare your genes of interest with pathways (typically gene sets) and quickly identify enriched pathways. Use the built-in support for conversion of gene identifiers to convert gene ids from other species to human gene symbols and enable comparison with publicly available pathways.
Visualize the resulting pathways in Running Enrichment score plots, heatmaps and gene lists and leading-edge overlap plots. All the plots can be exported with one click.

The GSEA Workbench is integrated and works side by side with the other functionality in the program making it easy and fast to test different approaches. The integration makes it possible to export gene lists (pathways) from the GSEA Workbench to the variable list panel in the main program and continue detailed analysis of the underlying data based on the outcome of the GSEA analysis.
You can read more about Pathway analysis.
Does it work on my data?
Answer the four quick questions below and find out if you can use Qlucore on your data.
For more details about supported data formats and data import see Data Import or Contact us with questions.
Case Studies
Using Qlucore in epigenetics research studies
Cancer Genetics Program at the Hospital for Sick Children (SickKids) in Toronto, Canada.A range of samples including DNA from patient blood, primary tissue from tumors, and cell lines, are studied.
Analysis of public data using Qlucore
Beijing Normal University, ChinaThis case study is an example of how the use of public information from multiple sources was used to propose a new classification for glioma cancer.
Qlucore analysis of transcriptomic data
University of Manchester, UKThe study includes working with data from more than 400 arrays. Visualization is used in the effort to understand the human growth process.


