Analyze
One of the cornerstones for quick and efficient data analysis is a flexible and easy to use statistical framework that can be combined with visualizations and plots to reveal valuable insights. Qlucore Omics Explorer is fast and include a broad scope of analysis options for multi-omics and NGG data (count-based as well as continues).
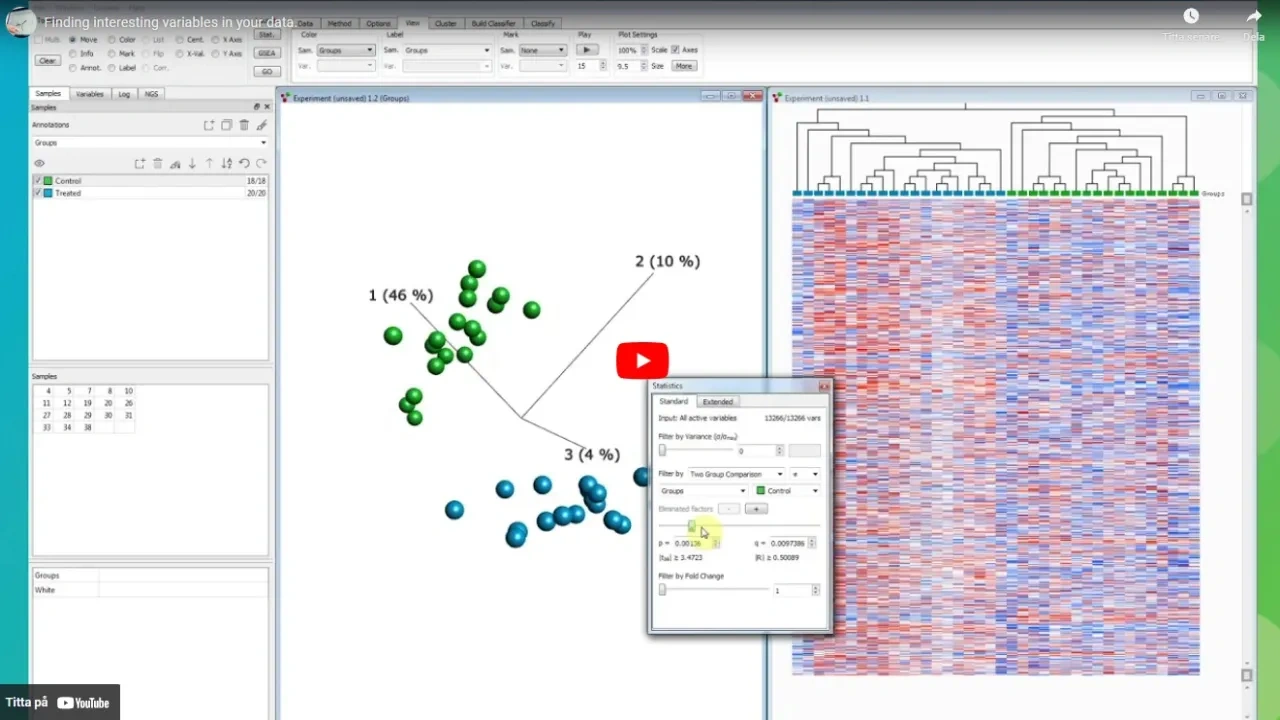
Finding interesting variables in your data
Wide ranges of statistical methods and metrics for continuous data. Both parametric and non-parametric tests:
- two group comparison (t-test, Welch or Mann-Whitney)
- paired t-test
- multi group comparison (ANOVA or Kruskal-Wallis)
- two-way ANOVA
- linear, quadratic and rank regression,
- quadratic regression
- rank regression
- fold change and difference (log Fold change)
- Tukey
- Kaplan-Meier
Further, extensive support for count-based data with support of native DESeq2:
- Wald (two-group, linear, rank regression, and paired two-group
- LRT - likelihood ratio test (two-group, multi-group, linear, quadratic, rank regression and paired two-group)
- Independent filtering
- fold change and difference (log Fold change)
Batch correction is supported by the eliminated factors functionality.
Expand to additional methods with the Open API to R.
Biomarker discovery analysis
The Biomarker Workbench is optimized for experiments and studies in the areas of drug development and biomarker discovery. Easily set up a suite of different statistical tests to run in batch mode with the objective of selecting effective compounds or other relevant signals. Add post hoc analysis including Tukey and Fold change.
Inspect the results in tables and directly use the structured outcome for the following analysis steps. The Response variable option is tailored for biomarker discovery and assists in finding correlations between sample annotations – an excellent way to focus on key annotations when working with large amounts of clinical data.
Survival analysis
Survival analysis is supported with integrated statistical methods such as Hazard ratio calculations as well as visualizations in Kaplan-Meier plots.
Genome analysis
With the NGS module and the NGS filters more options are available. Select which regions of the genome to analyze in the Genome browser, dynamically select if the regions should be restricted by read coverage, specific regions or if variants should be present or not.
Cluster analysis
Clustering is supported in several ways; either in a semi-supervised mode using PCA or t-SNE or UMAP with Projection score and variance filtering or in an unsupervised mode using kmeans++. Hierarchical clustering is combined with the heatmap plot.
Classification and machine learning
The Build classifier and Classify machine learning functionality enables both the option to easily build classifiers based on models such as Boosted trees, Support Vector Machines (SVM), Random Trees (RT) and kNN and to classify new samples.
Pathway analysis
To compare and enhance your findings use the integrated GSEA Workbench which is set-up using only a few mouse-clicks. It does not get easier. Easy conversion of gene IDs from different species to human orthologs is supported.
Keep track of the calculations
The Status panel will continuously show exactly what calculations have been applied to your data. The local outlier factor functionality further enables the user to store a logpoint with the current program state including all plots and all settings. The logpoint can later be restored.
Scripted workflows
Templates is the functionality used for scripting workflows in the program. You can use built-in templates as a quick start to standard analyses or write your own templates to simplify repetitive tasks. Templates are also the tool for integration of the program into tool chains.
Read about all features in Qlucore Omics Explorer.
