Principal Component Analysis (PCA)
Qlucore Omics Explorer makes Principal Component Analysis (PCA) easy.
Principal component analysis software for 3D PCA plots
Qlucore Omics Explorer is the easy to use visualization-based data analysis tool with inbuilt powerful statistics that delivers immediate results and provides instant exploration and visualization. The program supports a broad spectrum of multi-omics and NGS data.
PCA reduces data dimensionality and focuses on the informative parts
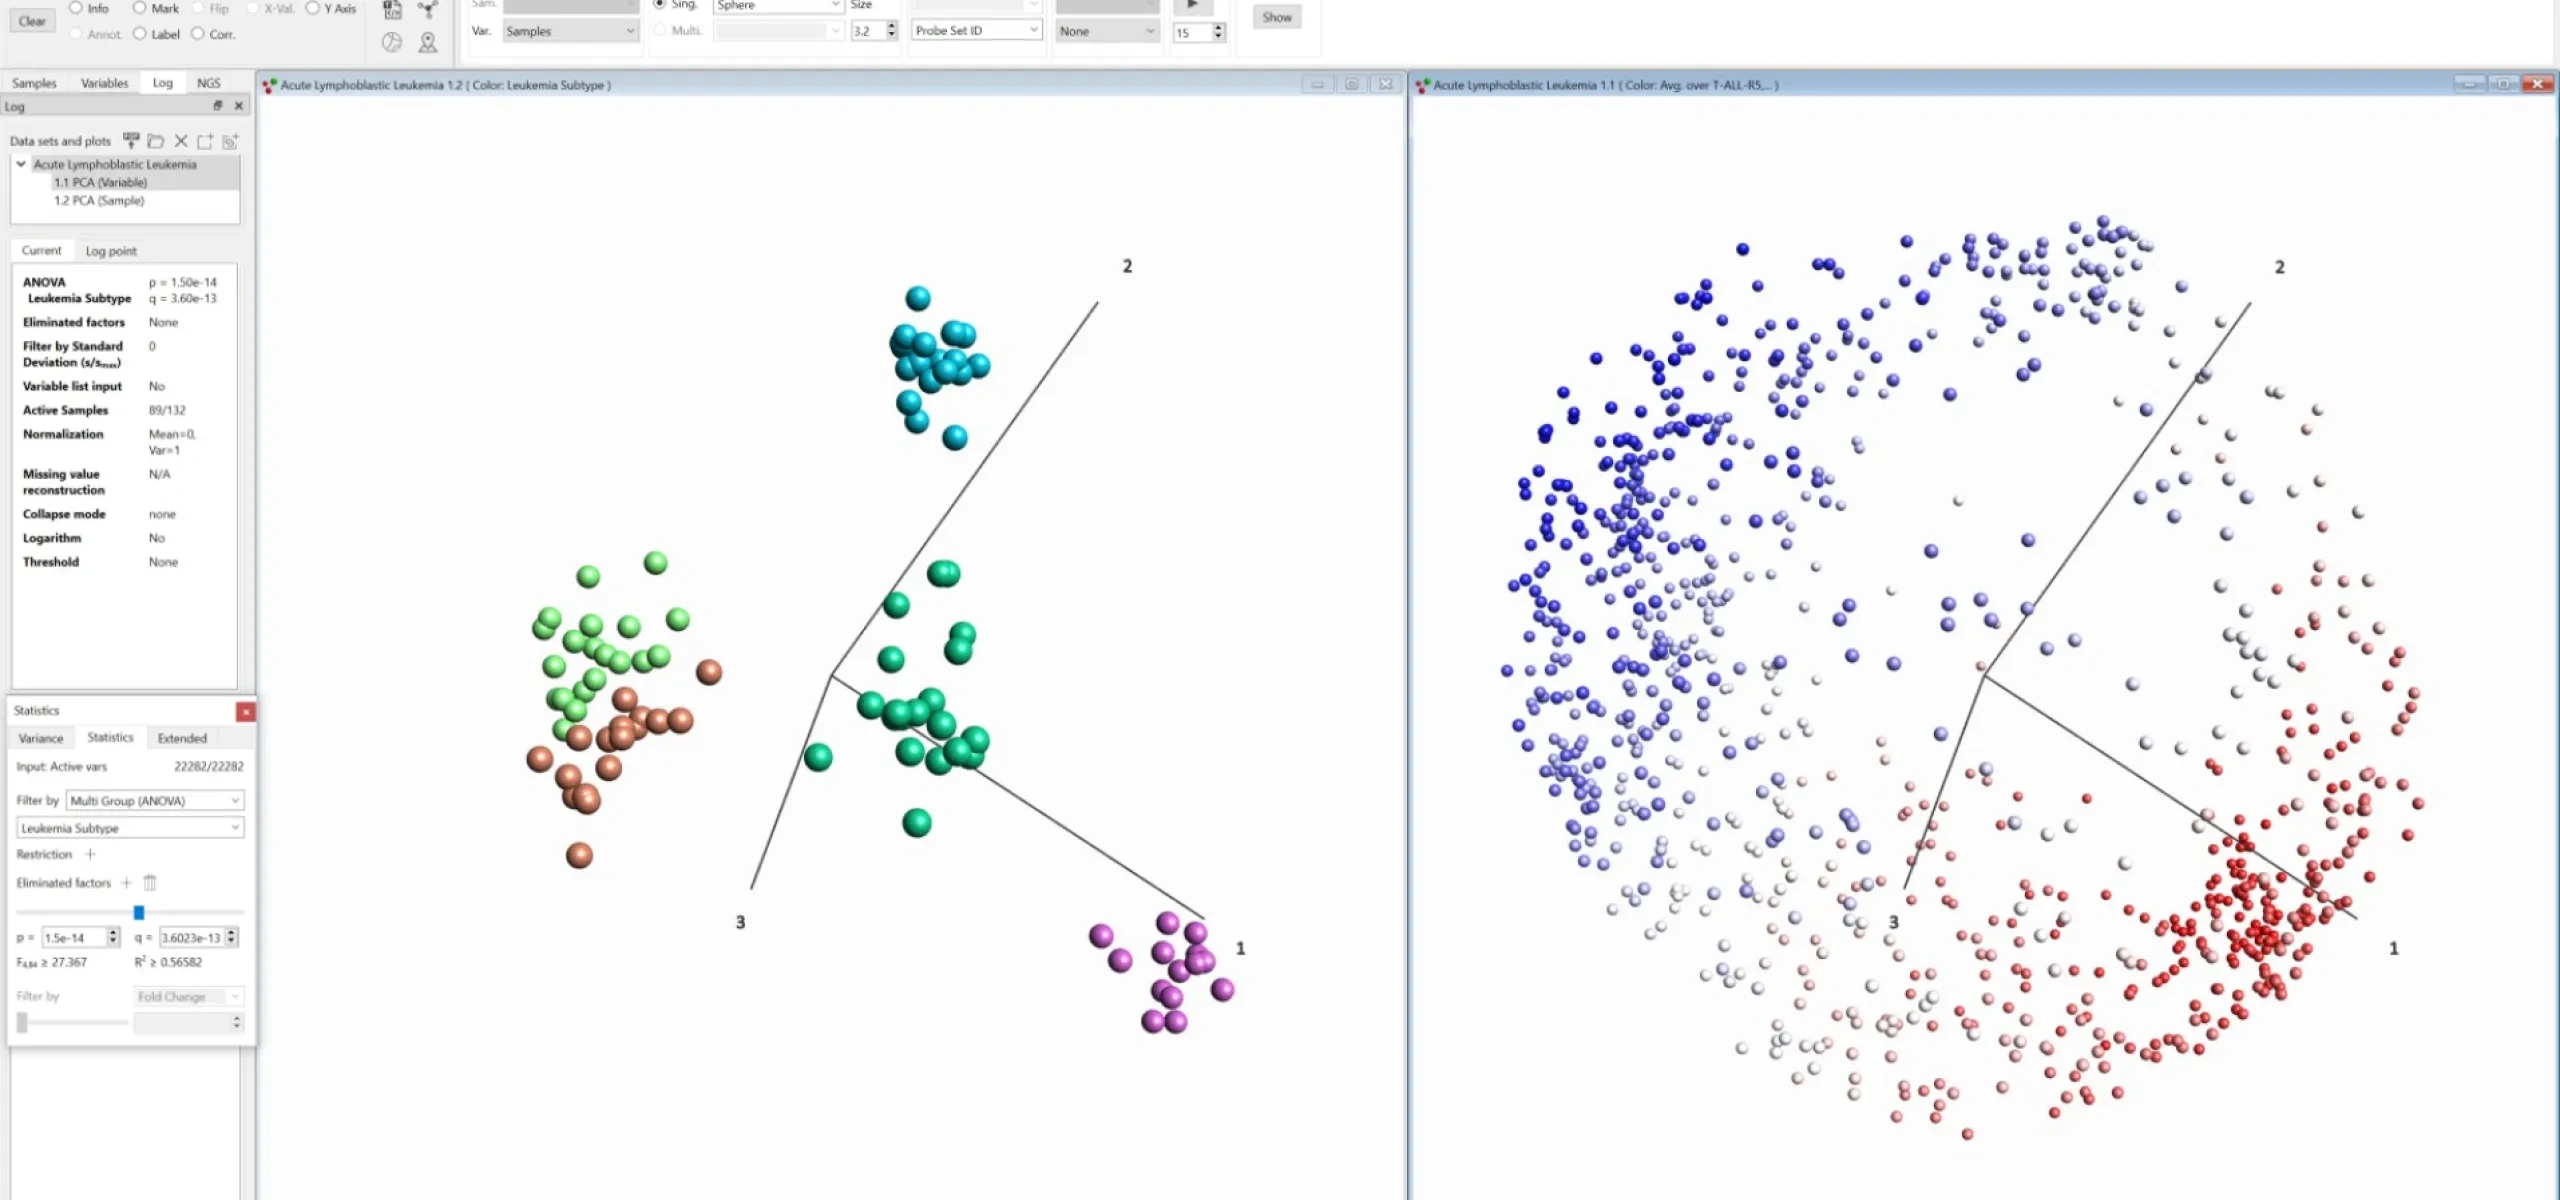
Qlucore Omics Explorer encourages an extensive use of PCA plots and PCA analysis for data exploration. In the interactive three dimensional PCA plot, data is updated instantly as filters and settings are changed during the analysis work-flow. This makes it easy and fast to explore and evaluate complex data. PCA analysis enables new data insights.
With just one click you can automatically find the strongest signals in your data set - maybe even revealing sample groups that you were not aware of.
PCA plots can be used to visualize both samples/variables in an synchronized mode, as demonstrated in the figure above, with samples to the left and variables to the right. Qlucore Omics Explorer includes a rich set of other plot types and more than 15 plot types can be combined with the PCA plot. More advanced plots includes heatmaps and UMAP plots.
A comparison between PCA and hierarchical clustering
Graphical representations of high-dimensional data sets are at the backbone of straightforward exploratory analysis and hypothesis generation. Within the life sciences, two of the most commonly used methods for this purpose are heatmaps combined with hierarchical clustering and principal component analysis (PCA).
What is Principal Component Analysis?
In this overview document we will describe the basic characteristics of principal component analysis (PCA) and explain why it is such a powerful way of visualizing large data sets.
We will use the terminology ‘data set’ to describe the measured data. The data set consists of a number of samples for which a set of variables has been measured. All variables are measured for all samples.
Does it work on my data?
Learn more


