RNA-seq single cell analysis
Qlucore Omics Explorer is a next-generation bioinformatics software for research in life science, biotech, food and plant industries, as well as academia. The powerful visualization-based data analysis tool with inbuilt powerful statistics delivers immediate results and provides instant exploration and visualization of big data including single cell data.
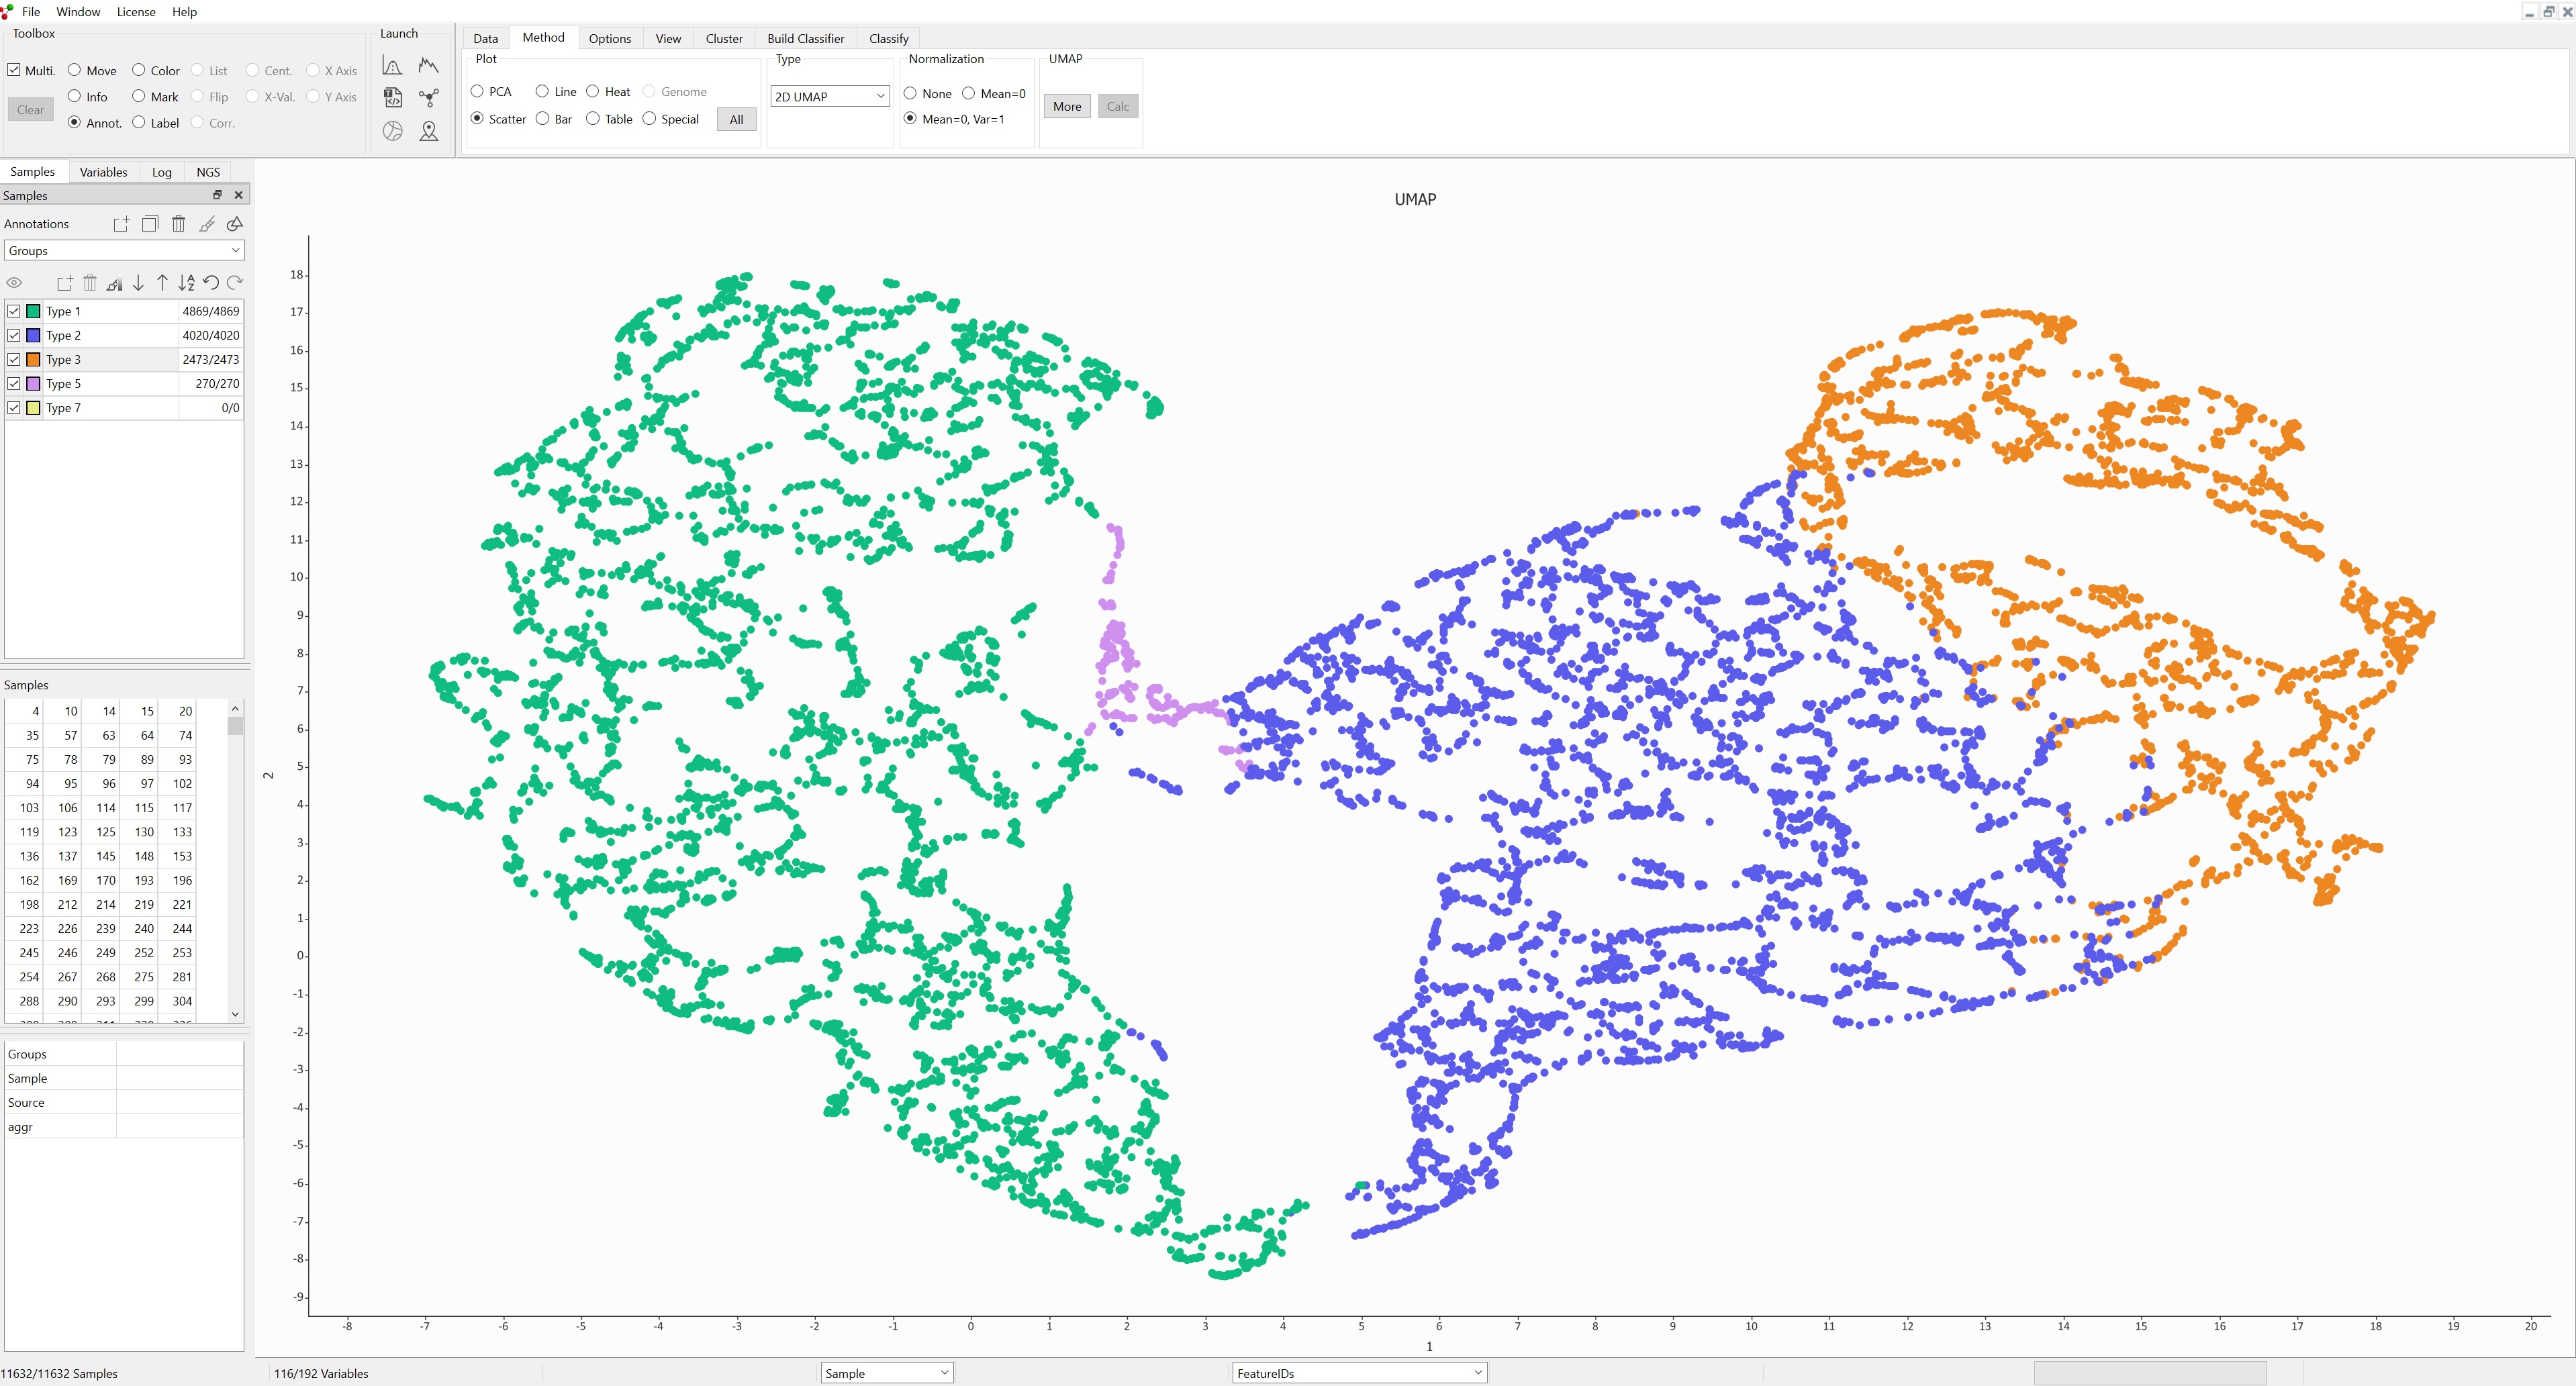
Single cell RNA-seq is a technique that is widely used. The amount of data generated from these experiments tends to be large, and data sets with many thousand samples (cells) are commonplace. Large data sets and fast analysis are exactly what Qlucore Omics Explorer is designed for. Using an ordinary PC/laptop you can work with these extremely large data sets and use visualizations such as PCA, t-SNE and UMAP to gain new insights.
Other important functionalities are:
- Direct import of 10x data (using Qlucore templates) including support for H5 data format.
- Automatic data filtering and optional data normalization.
- Variable pre-filtering to remove variables with few real measurement points across samples
- Subsampling to reduce the number of samples
- k-means++ clustering and ISOMAP
All of the above functionality can be used with any type of data and all existing functionalities can be used for single cell RNA-seq data.
Get tips and tricks on Single cell analysis.
Read more about RNA-seq analysis.
RNA-Seq analysis using Qlucore
Stanford University, USPerforming gene expression analysis based on RNA sequencing data, in Dilated Cardiomyopathy studies.
Analysis of public data using Qlucore
Beijing Normal University, ChinaThis case study is an example of how the use of public information from multiple sources was used to propose a new classification for glioma cancer.


