VIDEO and FREE TRIAL
Qlucore Omics Explorer video
Qlucore Omics Explorer free trial
Accelerate, simplify and improve research and cancer diagnostics with visualization-based analysis.

Advances in next-generation sequencing are giving us the raw data to research, explore and improve diagnosis, with more ambition than ever. Qlucore visualization-based solutions make it easier for researchers, technicians and physicians to easily explore, interpret and make clinical decisions.
Would you like to experience Qlucore Omics Explorer or Qlucore Insights before making a purchase? You can download the trial software for PC or Mac at no cost.
DownloadNot sure how to get started, or which Qlucore solution best suits your needs? Contact us for advice on selecting the right software to advance your research and diagnostic goals today.
Contact usQlucore was founded by a multi-disciplinary team with a passion for transforming complexity into clarity—and a vision to unite research, diagnosis and care in the pursuit of precision medicine.


Learn how easy it is to manage complex datasets and quickly gain insights and results to power your research.

Explore analysis topics and themes in our ongoing webinar series, and sign up for notification of new ones.

If you’re new to Qlucore, take our introductory tour of set-up and operation designed to get you up and running quickly.

Ready to make omics data analysis faster, simpler and more powerful for your team? Contact us for a no-obligation quote.

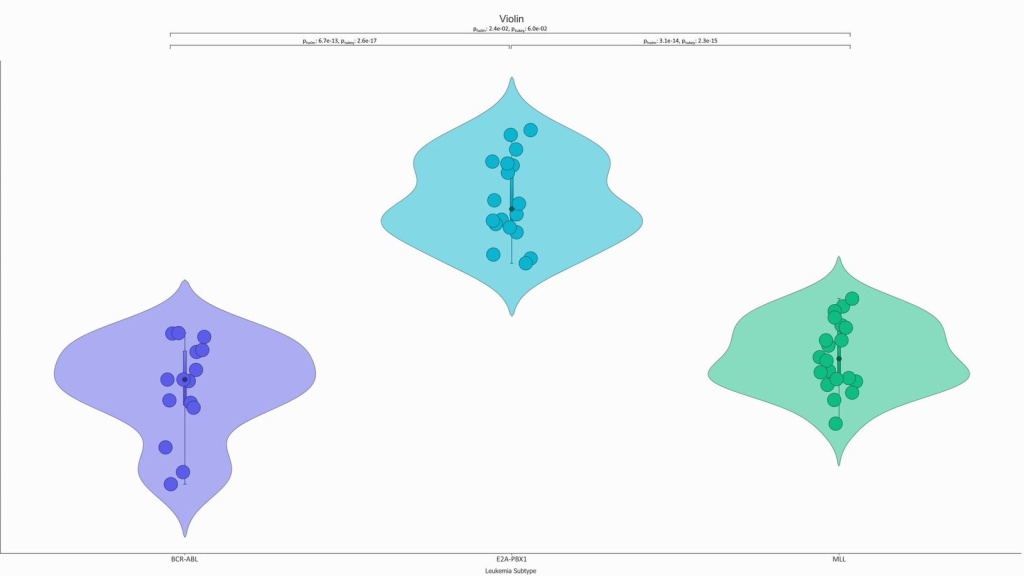
Easily and quickly create any of 15 different types of plots to make new discoveries or visualize your findings Are you looking for a faster way to c...

Molecular classification of lung cancer from whole transcriptome data The first generation of Qlucore’s lung cancer model is able to identify if the ...

We are proud to introduce an upgraded version of Qlucore Omics Explorer. The new version 3.9 supports even clearer visualization in the 3D PCA pl...

Use fantastic speed to boost your findings and scientific creativity with Qlucore Omics Explorer Qlucore Omics Explorer (QOE) is up to 2800 times...